

СУПУТНИКОВІ ЗНІМКИ ДЛЯ ПЛАНУВАННЯ РОБІТ НА НАСТУПНОМУ РІВНІ

ВИД ЗОНИ ПОСІВУ ДЛЯ ПОКРАЩЕННЯ УПРАВЛІННЯ ПОЛЕМ

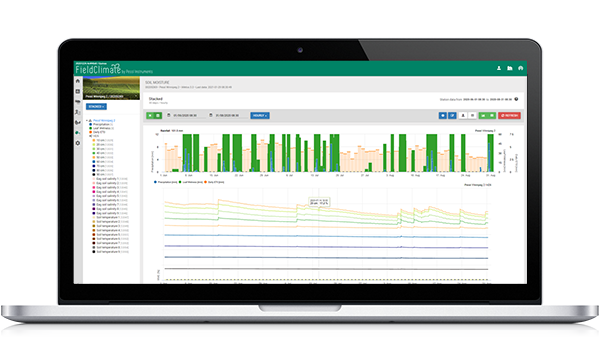
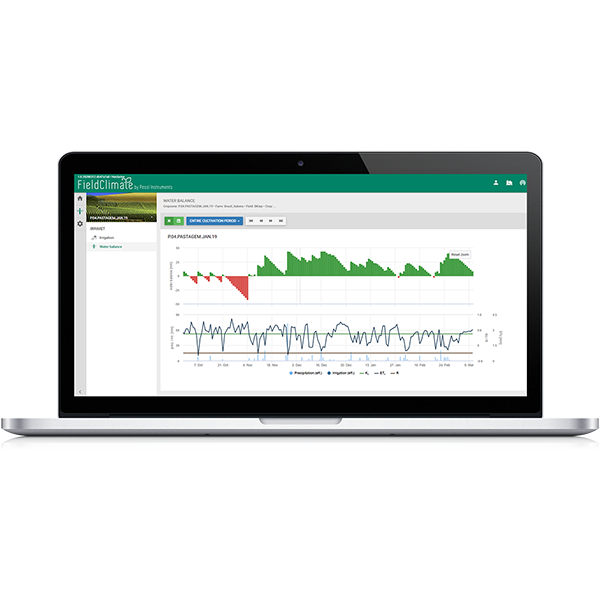
РОЗУМНЕ УПРАВЛІННЯ ПОЛИВОМ З IRRIMET

Доступ до моделей хвороб рослин потребує сезонної підписки
Доступ до прогнозів погоди (погодинні, 3-денні, 7-денні прогнози і більше) вимагає річної підписки
Доступні API інтеграції