
0. FAQ
Questa funzione è stata introdotta nel nostro nuovo sistema di database, ma funziona solo se il fuso orario del dispositivo è impostato correttamente. Si consiglia di controllare Impostazione della stazione > Configurazione > Fuso orario della stazione. Se il fuso orario della stazione non è impostato correttamente, viene visualizzato un messaggio di avvertimento. È possibile memorizzare il fuso orario semplicemente facendo clic su SALVA POSIZIONE. Sì, i nomi e le unità definiti nella vecchia versione vengono importati e il sistema continua a sovrascrivere le impostazioni della vecchia versione finché non si fa clic sul pulsante DISATTIVA AUTOSINCRONIZZAZIONE su Impostazioni della stazione Pagina. Se si è pronti a utilizzare preferibilmente la pagina fieldclimate.comSi consiglia di fare clic su questo pulsante per disattivare la sincronizzazione automatica e la nuova impostazione verrà regolarmente salvata. Una volta premuto questo pulsante per una delle vostre stazioni, l'impostazione viene estesa a tutte le stazioni del vostro account.0.1. PREFAZIONE
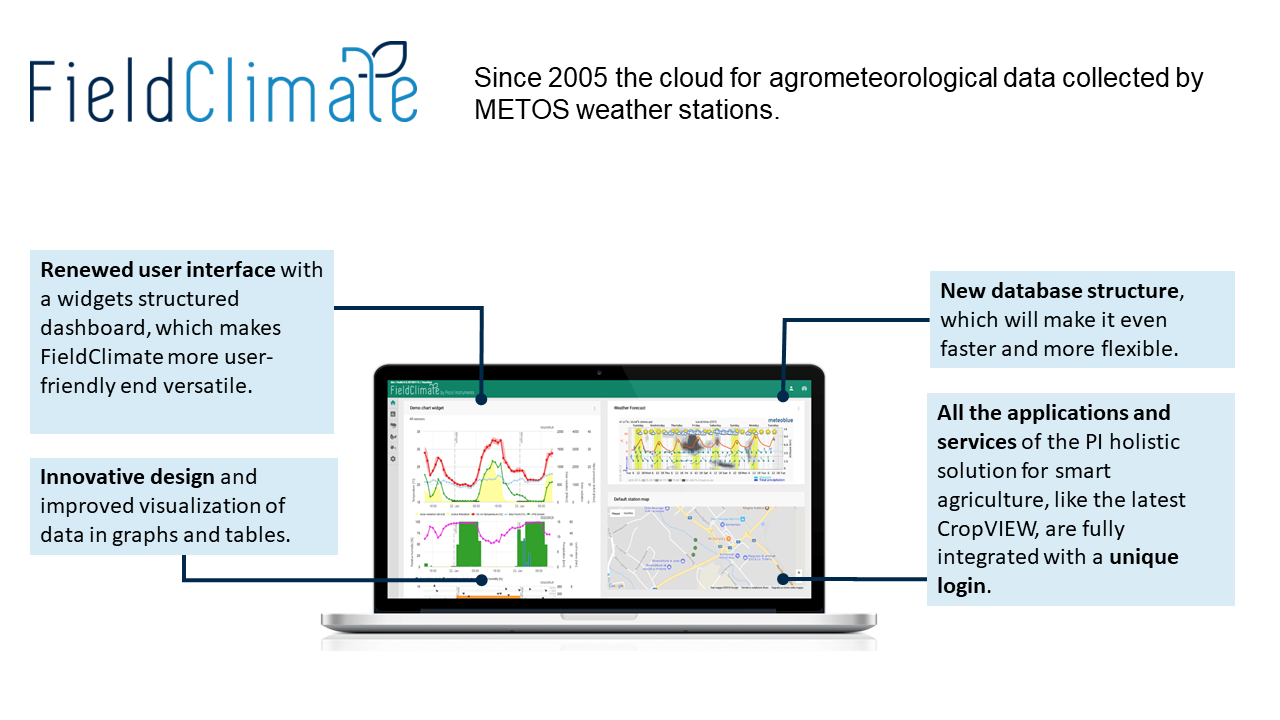
FieldClimate è la piattaforma cloud utilizzata per presentare i dati agrometeorologici raccolti dall'METOS.® stazioni meteorologiche e data logger. Cambiamenti chiave con la nuova generazione di FieldClimate:- Interfaccia utente rinnovata basata sui widget
- Migliore visualizzazione dei dati
- Digiuno e flessibilità
- Tutti METOS® servizi integrati in un'unica piattaforma come soluzione olistica
1. COME UTILIZZARE L'FieldClimate
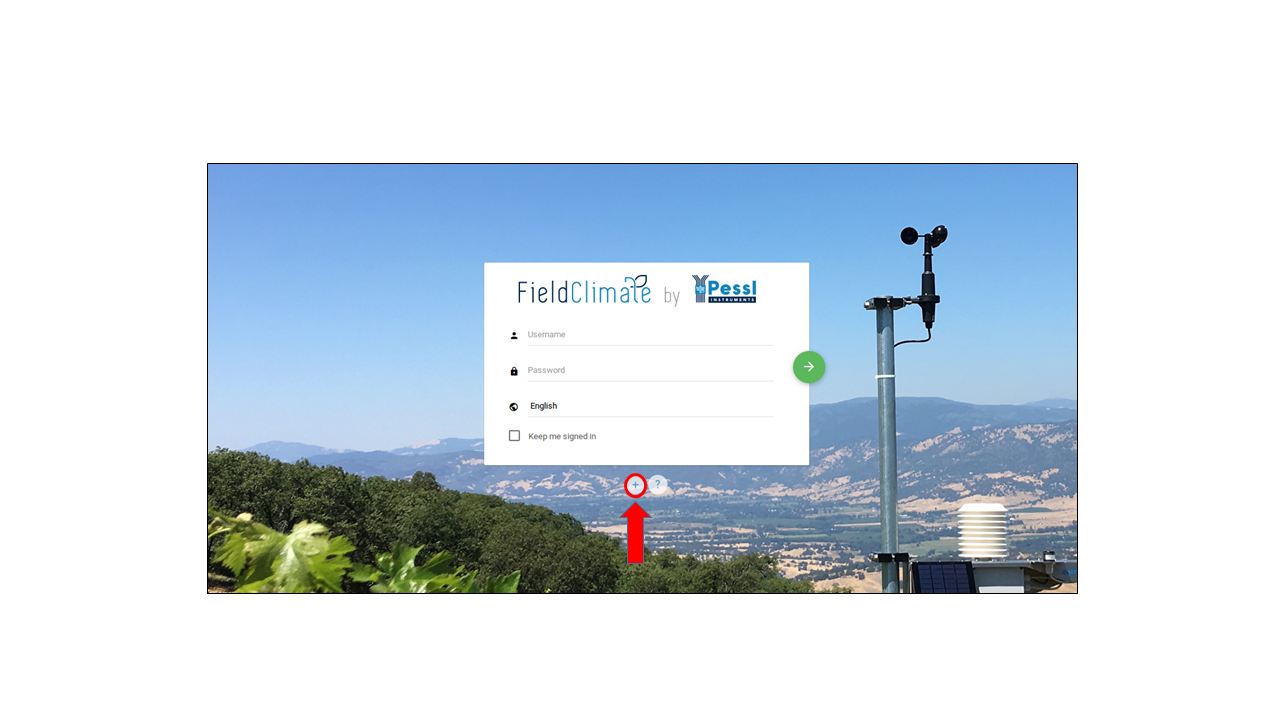
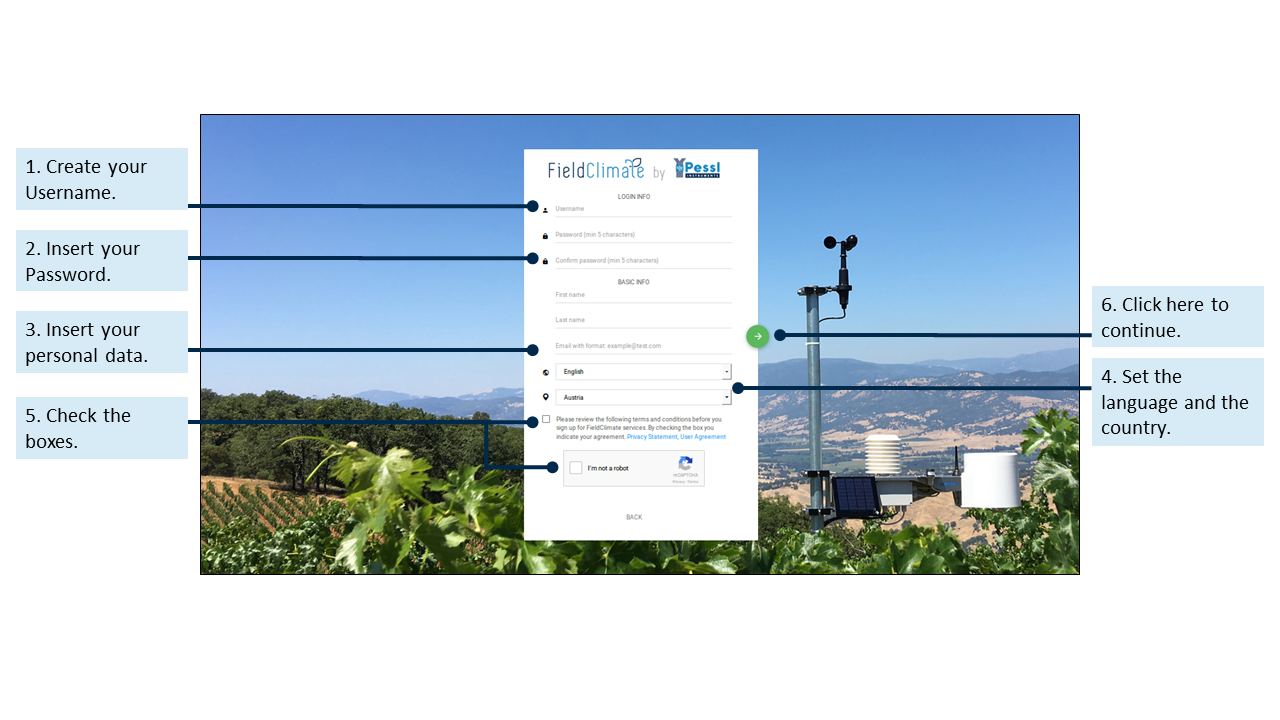
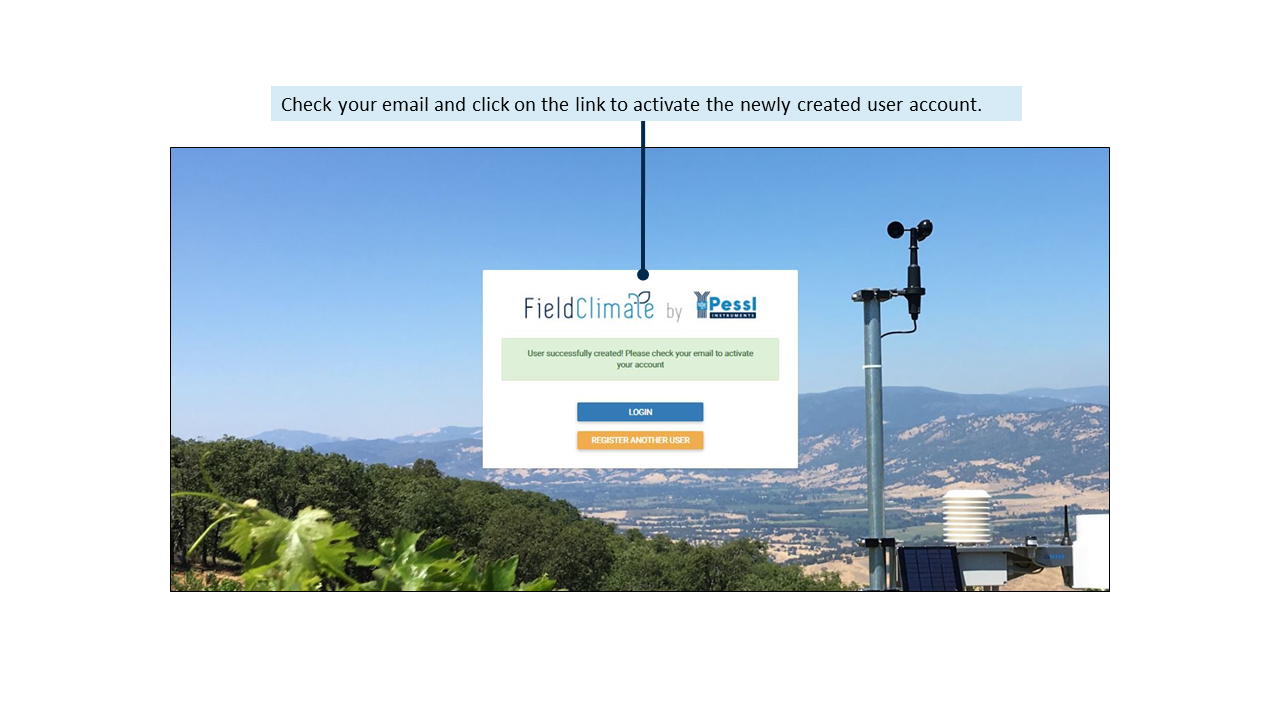
1.1. REGISTRAZIONE
Vai a
1.2. ACCESSO
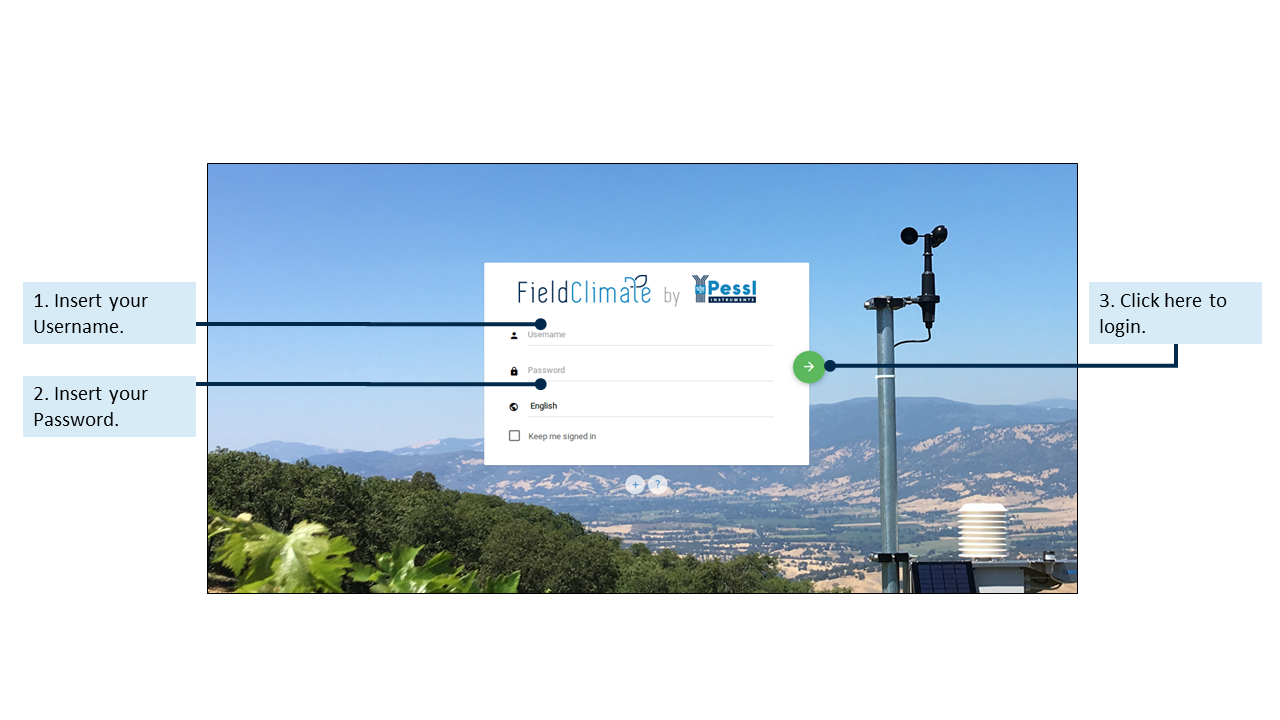 Una volta creato con successo l'account, inserire il nome utente e la password per accedere e apparirà il cruscotto principale. Nell'angolo in alto a destra sono presenti due icone che rappresentano i primi passi per l'utilizzo della potente piattaforma FieldClimate e l'impostazione delle principali configurazioni. Le due icone simboleggiano (da sinistra a destra) il menu utente e l'elenco delle stazioni, le cui funzioni sono spiegate di seguito. Attraverso la barra di navigazione, situata sul lato sinistro, è possibile selezionare altre pagine o tornare al cruscotto principale.
1.3. MENU UTENTE
1.3.1 AGGIUNGERE/RIMUOVERE UNA STAZIONE
Fare clic sull'icona del menu utente: qui è possibile aggiungere o rimuovere stazioni e accedere ad altre impostazioni utente. Per aggiungere il dispositivo, fare clic su menu utente > Aggiungi/rimuovi stazione. Verrà richiesto un numero di ID stazione e una chiave di stazione. Ora il piccolo adesivo argentato fornito con il dispositivo METOS® deve essere utilizzato. Questo adesivo contiene due tasti. La chiave 1 consente di modificare tutte le impostazioni dell'METOS.® mentre la chiave 2 è valida solo per vedere i dati del sistema. Per poter impostare l'METOS® inserire qui la chiave 1. Se è stata inserita la chiave corretta, l'elenco delle stazioni sarà ampliato da questo METOS® e può essere selezionata. In Impostazioni utente è possibile modificare la password.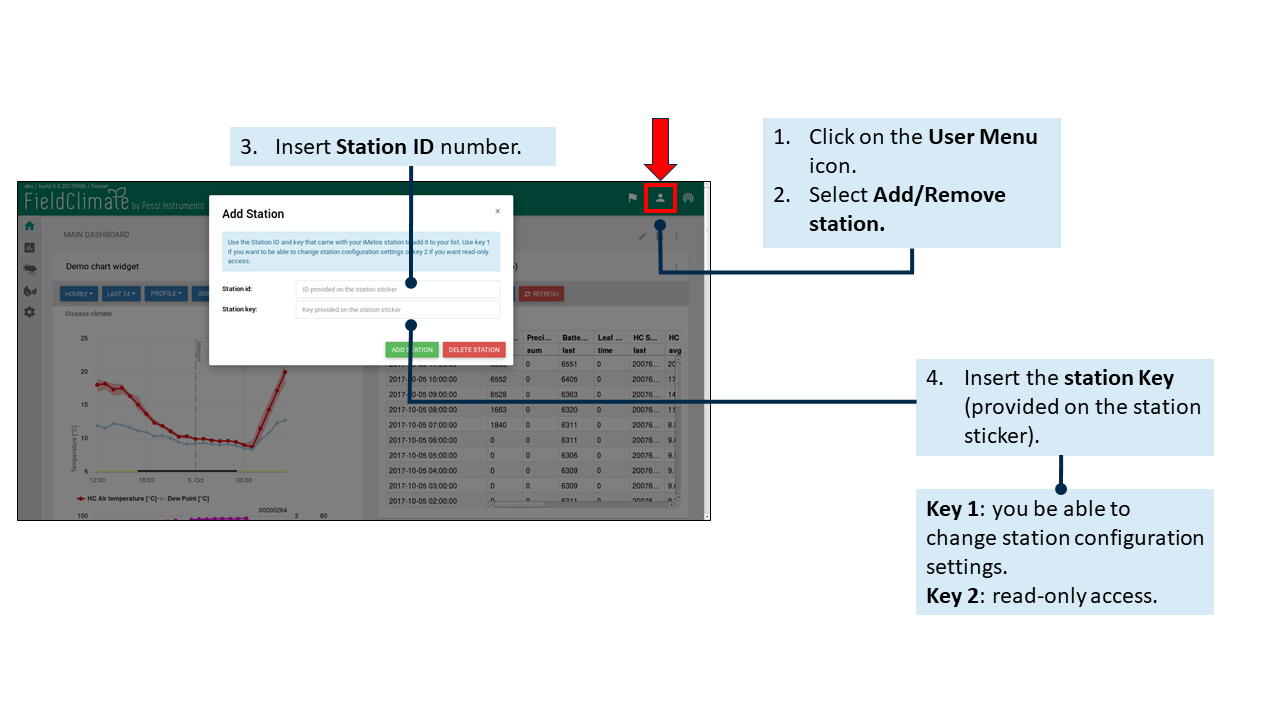
1.3.2 IMPOSTAZIONI UTENTE
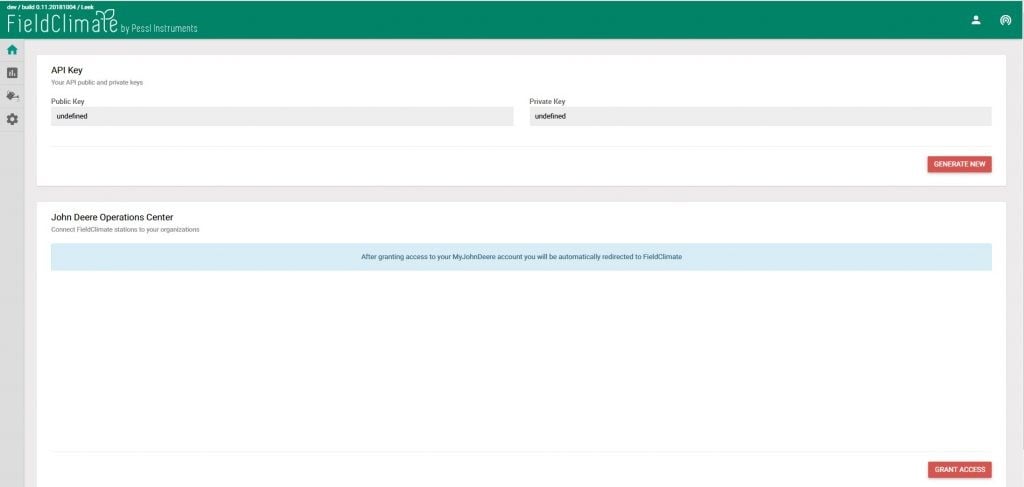
Fare clic sul menu Utente > Impostazioni utente per modificare e aggiornare le impostazioni dell'utente. In particolare, è possibile aggiornare la password, le informazioni personali e altre impostazioni come la lingua e l'unità di misura (metrica o imperiale). Ricordarsi di aggiornare le impostazioni una volta terminato.1.3.3 SERVIZI API
COLLEGAMENTO DEL FIELDCLIMATE AL CENTRO OPERATIVO JOHN DEERE 1. Menù utente > Servizi API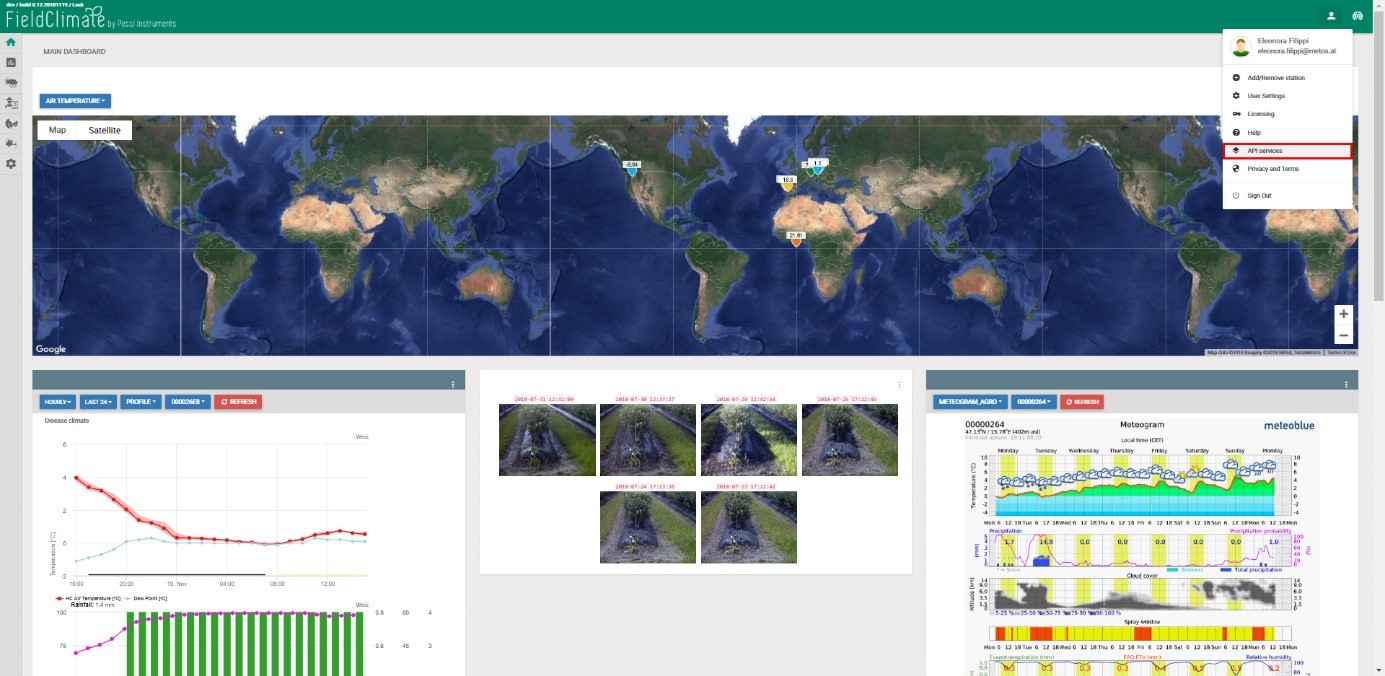 2. Fare clic sul pulsante "CONCEDI ACCESSO"; l'operazione potrebbe richiedere un paio di minuti, ma si verrà reindirizzati all'organizzazione del Centro operativo John Deere. Nota: per essere reindirizzati è necessario disporre di un account John Deere Operation Centre.
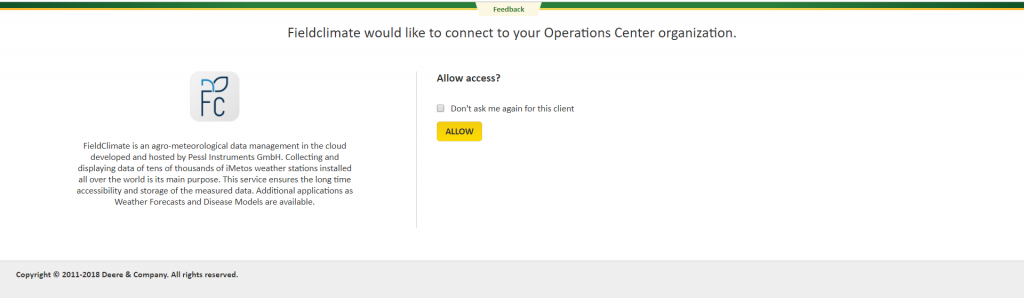
 3. Vi verrà chiesto di collegarvi a un account John Deere. Fare clic sul pulsante "CONSENTI" e selezionare anche la casella "Non chiedermi più questo cliente".
 4. In FieldClimate scegliere l'organizzazione John Deere con cui ci si vuole collegare. Verrà quindi presentato un elenco di stazioni/dispositivi. Fare clic su SÌ a quali si desidera collegare al Centro operativo John Deere. Saranno elencate tutte le stazioni/dispositivi, ma solo quelli a cui si ha accesso con la chiave 1 saranno collegati. In altre parole, le stazioni con chiave 2 non possono essere collegate a My John Deere.
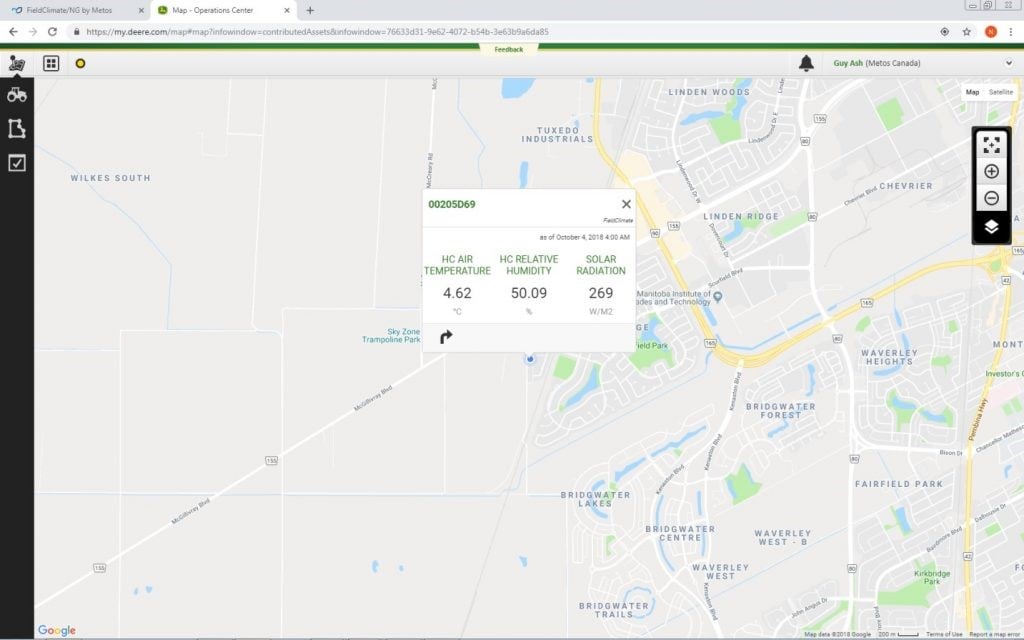
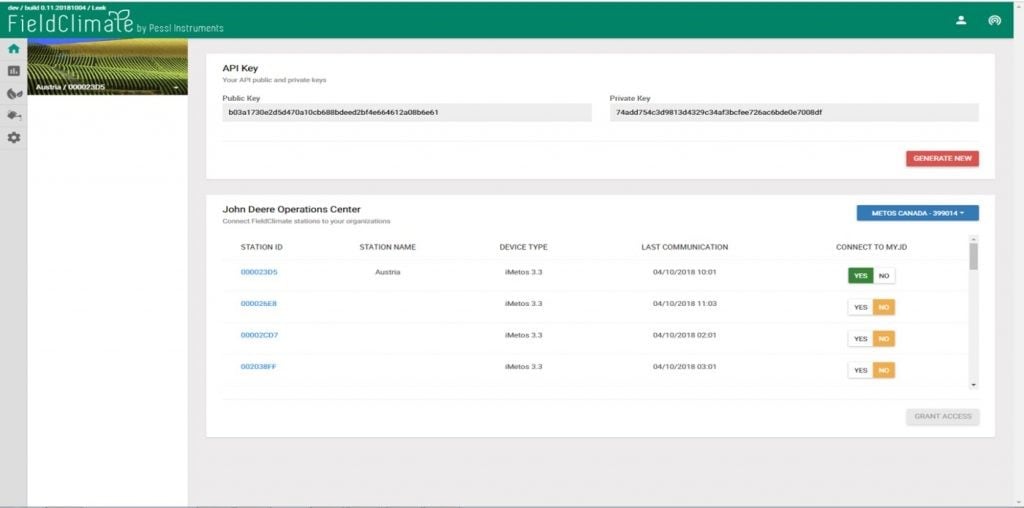 5. Una volta ottenuto l'accesso alle stazioni/dispositivi FieldClimate, sarete collegati al Centro operativo John Deere (immagine sotto).
 6. Se si desidera aggiungere stazioni o dispositivi in un secondo momento, è possibile fare clic su SÌ per connettersi a John Deere. Anche in questo caso, per aggiungere una stazione o un dispositivo è necessario disporre dell'accesso Key 1.
1.4 ELENCO STAZIONI
Fare clic sull'icona dell'elenco delle stazioni che consente di scegliere tra tutte le METOS® e selezionarne una singola. Ogni stazione ha un proprio numero di serie, un nome personalizzato e la sua ultima comunicazione: è possibile trovare la stazione per nome o per numero di serie. È inoltre possibile verificare se l'METOS® il dispositivo ha attivo l'abbonamento alle malattie delle piante o alle previsioni del tempo. Ricordate che per questi servizi è necessario che siano attivi gli abbonamenti corrispondenti.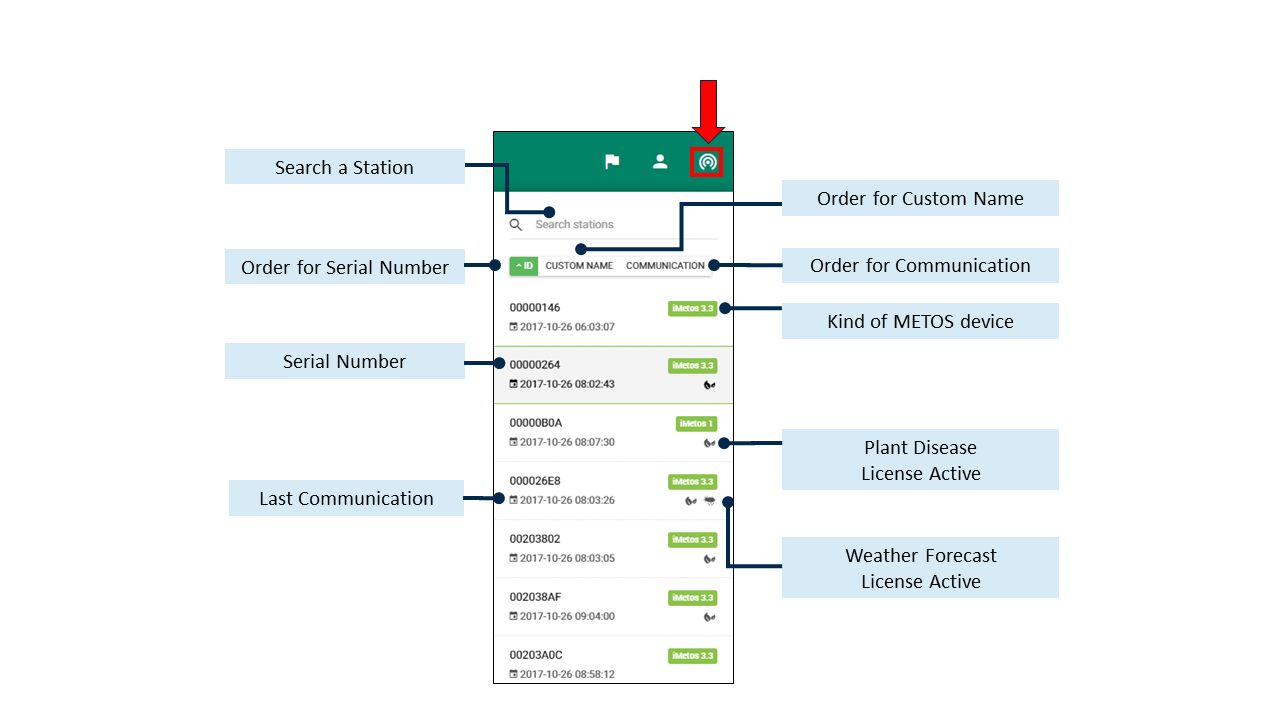
1.5 ELENCO DELLE NOTIFICHE
Le notifiche possono ora essere visualizzate a livello di server, come un elenco nel menu in alto a destra di FieldClimate. Oltre alla pagina delle notifiche individuali, all'interno delle impostazioni della stazione, gli utenti hanno ora a disposizione una pagina dedicata per accedere a tutte le notifiche, da tutte le stazioni, nello stesso posto. L'elenco delle notifiche comprende: un elenco di avvisi non letti, una pagina di cronologia con tutte le notifiche storiche e una pagina di configurazione per la modifica generale.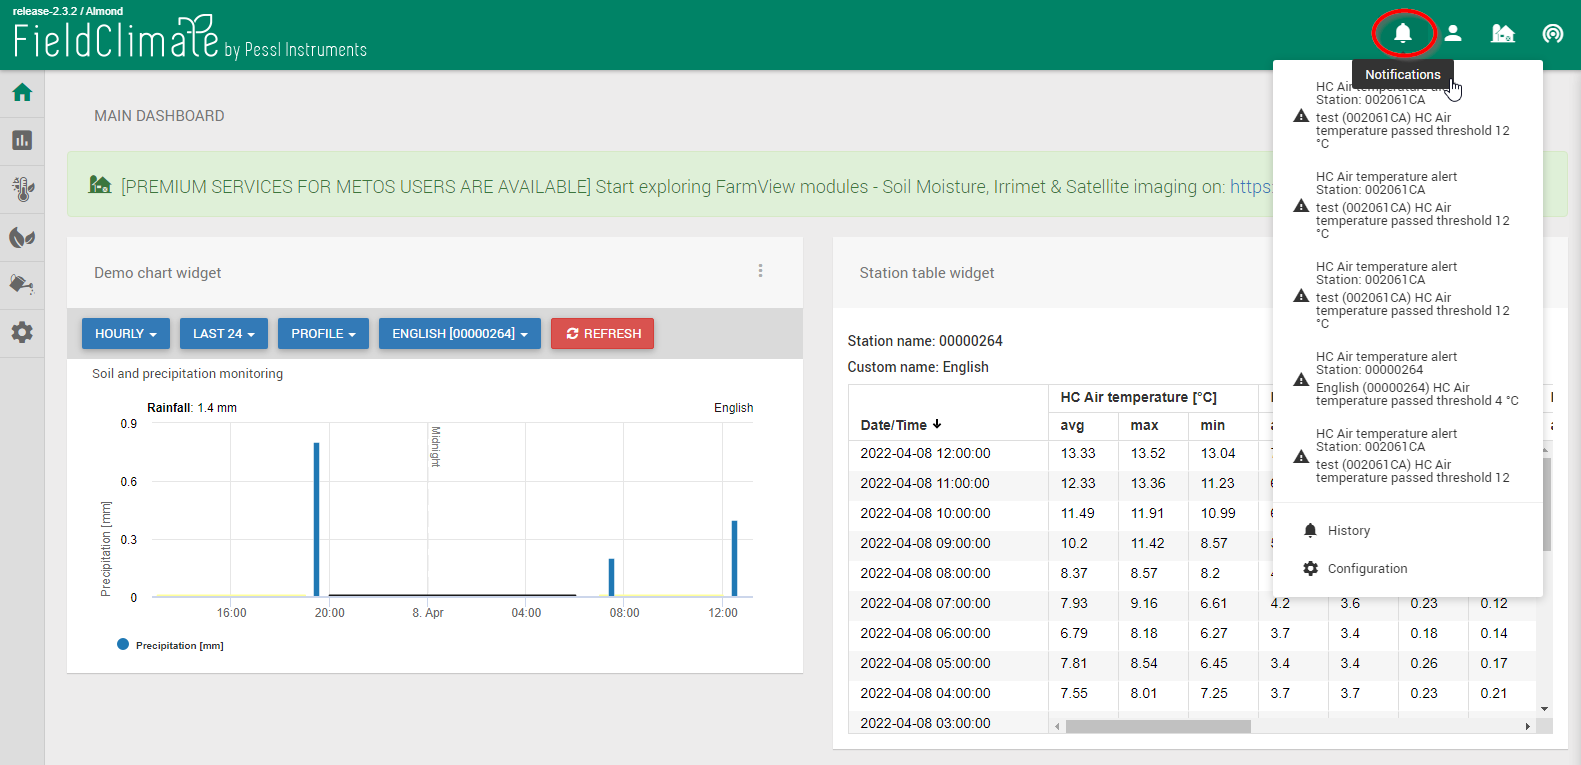 Nella sezione Cronologia, gli utenti possono vedere tutte le notifiche. In Configurazione è possibile creare nuovi avvisi per ogni ID di stazione e controllare tutti gli avvisi esistenti per quella particolare stazione.
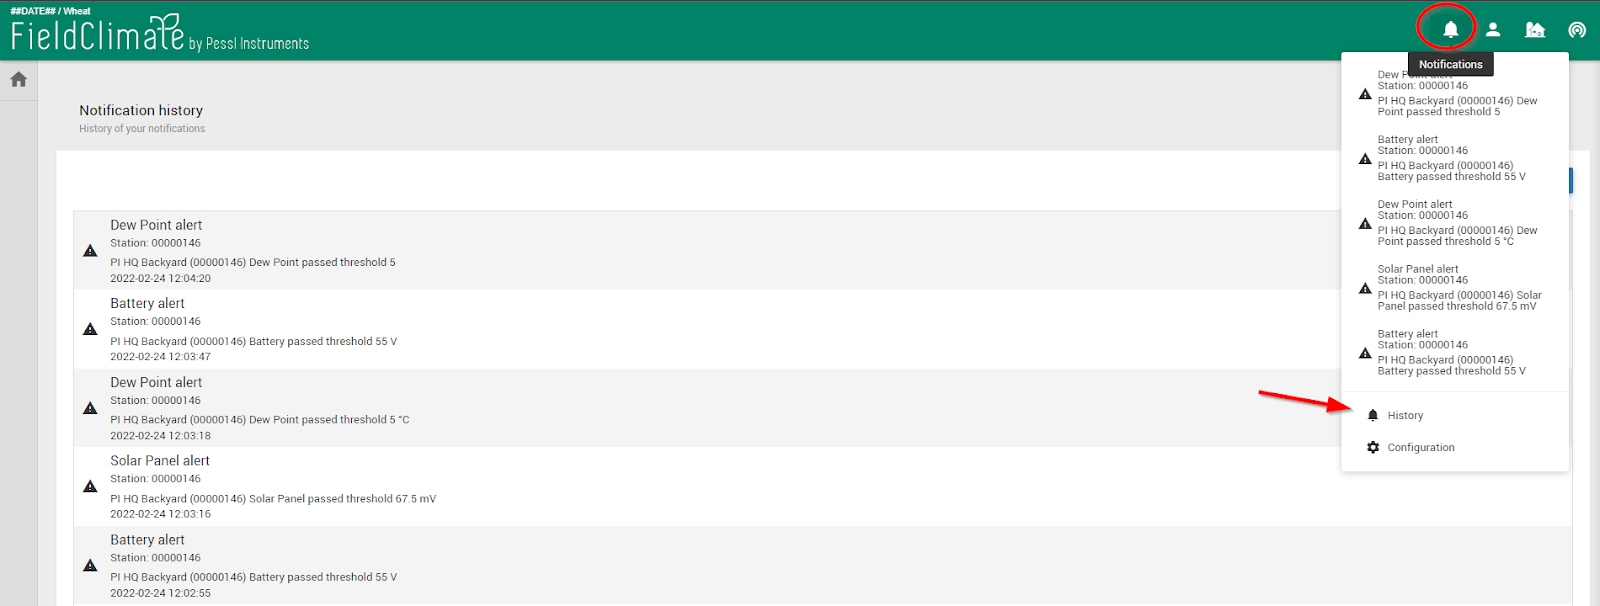
Di seguito è riportata la pagina della cronologia:
Nella sezione Cronologia, gli utenti possono vedere tutte le notifiche. In Configurazione è possibile creare nuovi avvisi per ogni ID di stazione e controllare tutti gli avvisi esistenti per quella particolare stazione.
Di seguito è riportata la pagina della cronologia:
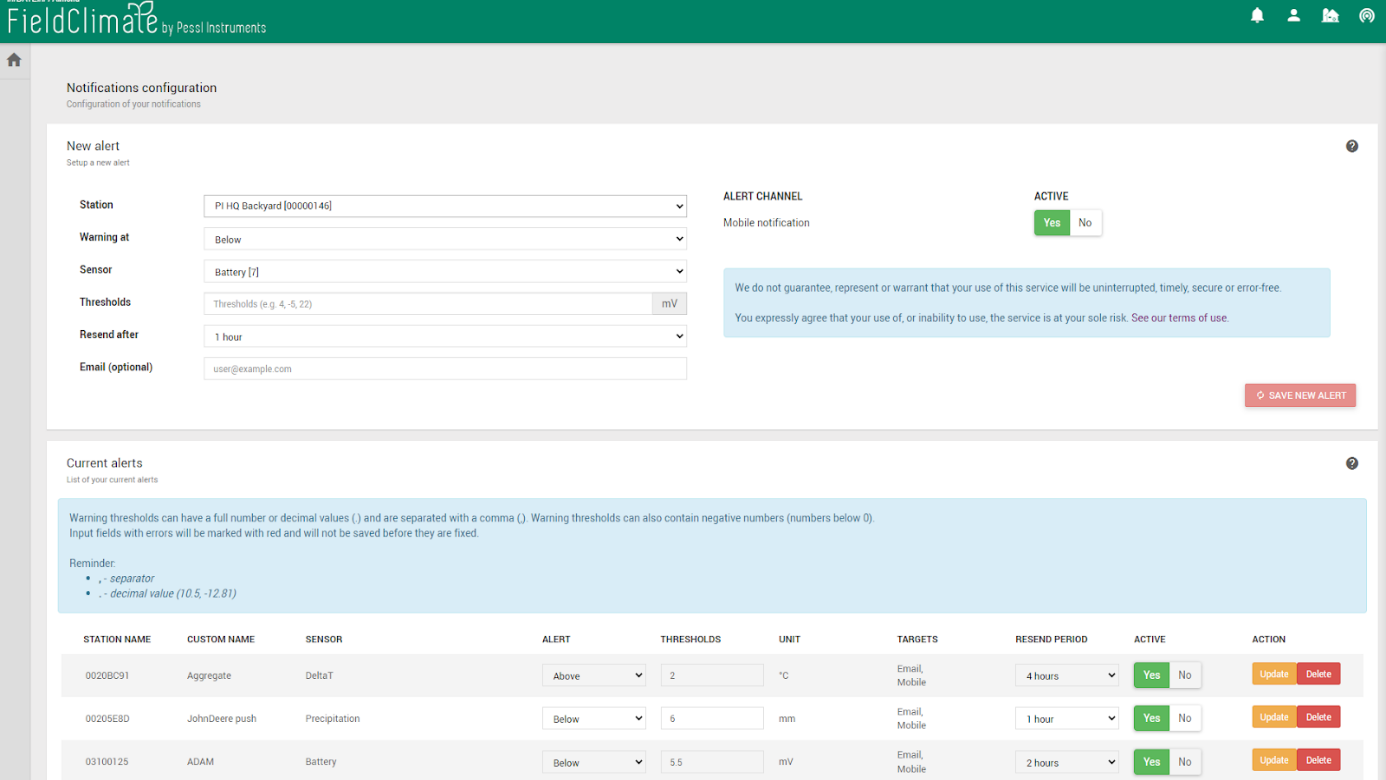
 Di seguito è riportata la pagina di configurazione:
2. CRUSCOTTO PRINCIPALE
2.1 IMPOSTAZIONI DEL CRUSCOTTO
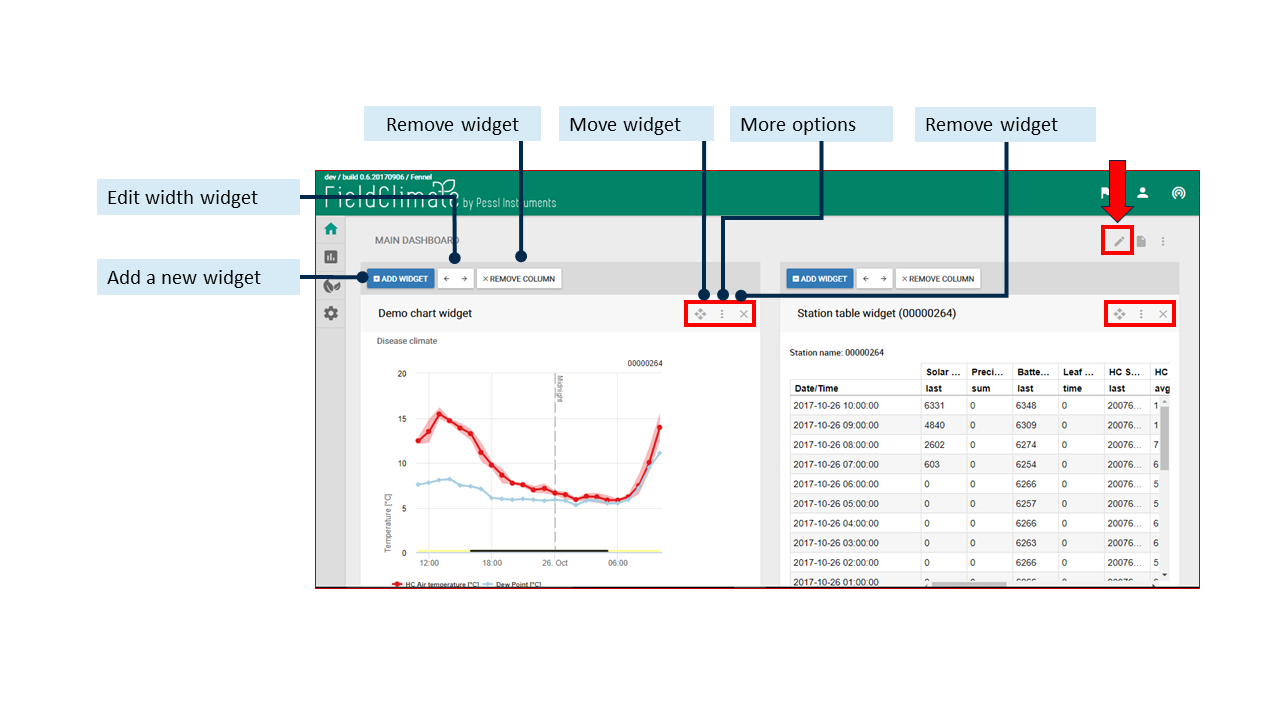
Grazie alla nuova Dashboard, con una struttura a widget, l'utente può gestire meglio l'accesso rapido ai servizi di maggiore interesse tra dati storici, previsioni meteorologiche localizzate ad alta precisione, modelli di malattie, dati sull'umidità del suolo, immagini CropVIEW, trappole per insetti e altri DSS (Decision Support Systems). Quando è stato selezionato l'METOS® il sito si ricaricherà e si vedrà la Dashboard principale. È possibile personalizzare completamente la Dashboard con i dati di proprio interesse (tabelle e grafici). Ad esempio, è possibile modificare la Dashboard aggiungendo o rimuovendo widget.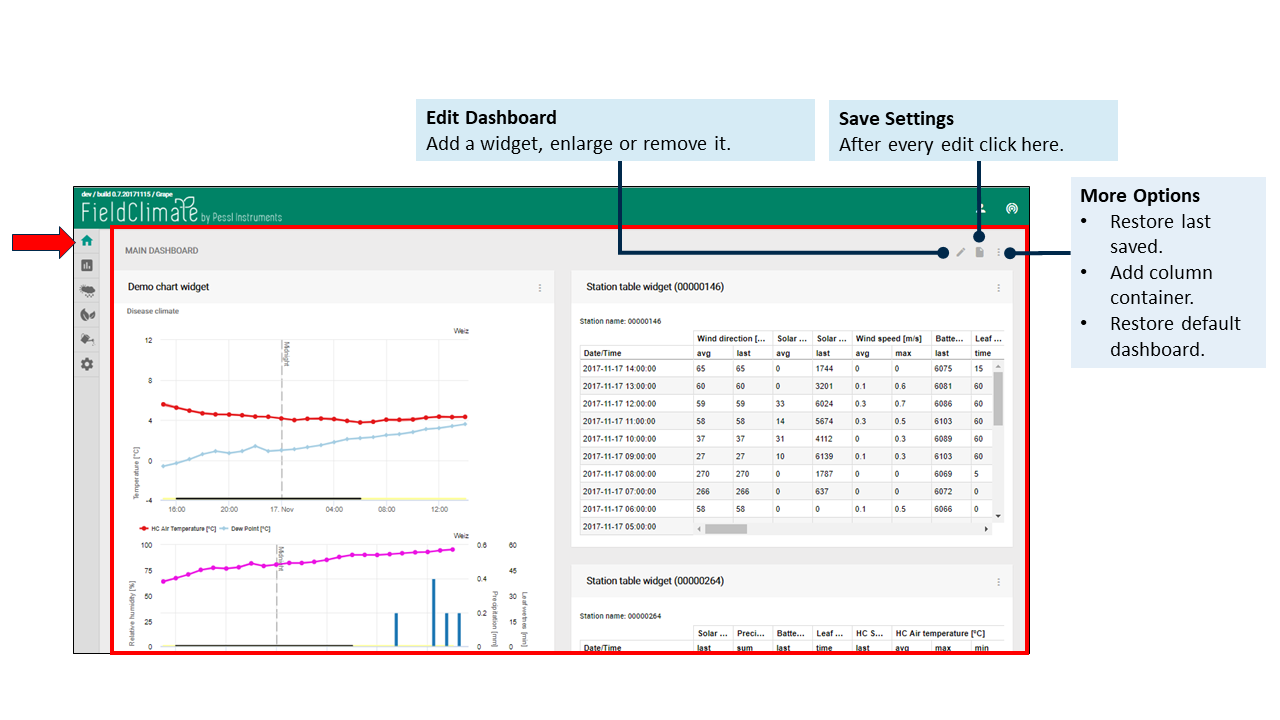 Facendo clic sul pulsante "Modifica Dashboard", apparirà una barra sopra ogni widget, dove è possibile aggiungerne uno, modificarne la larghezza o rimuoverlo.
2.1.1 AGGIUNGERE UN WIDGET
Fare clic sul pulsante "Aggiungi widget" e apparirà una nuova finestra in cui si dovrà inserire il widget:- Selezionare il tipo di widget.
- Inserire il titolo del widget.
- Inserire le descrizioni dei widget e scegliere il colore della finestra.
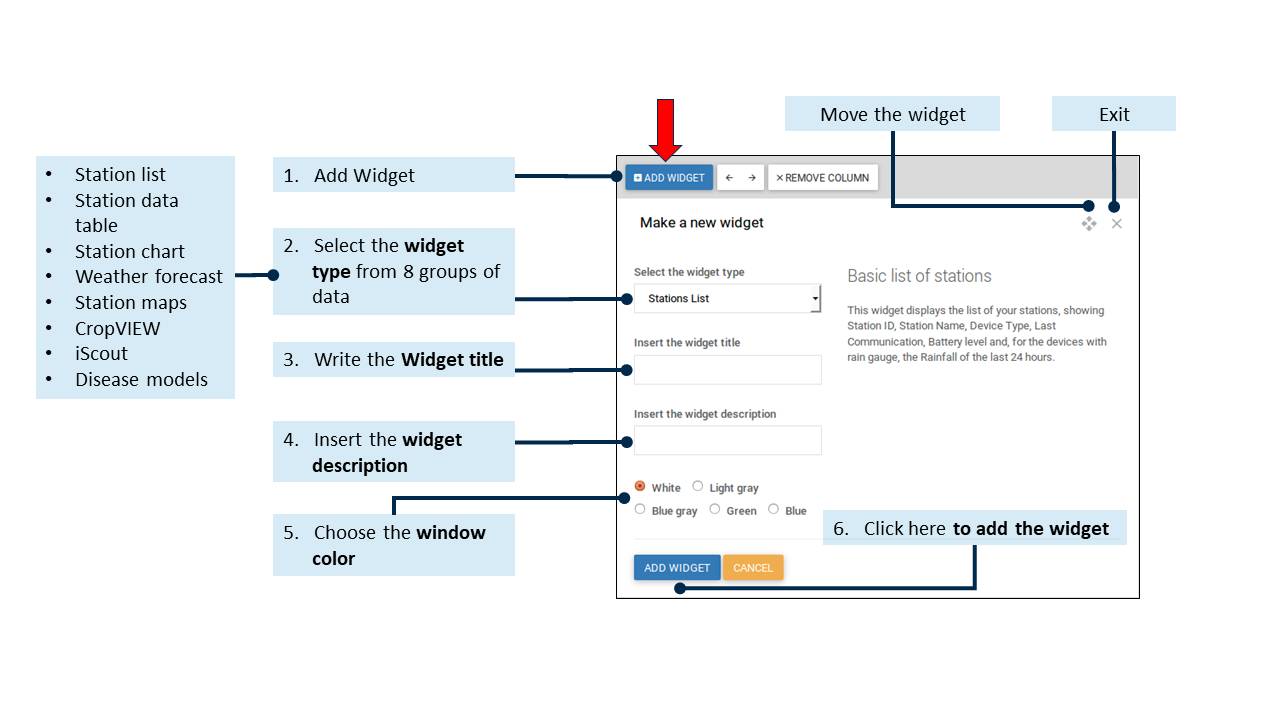 Ora è possibile scegliere il tipo di widget tra: Elenco stazioni, Tabella dati stazioni, Grafico stazioni, Previsioni meteo, Mappe stazioni, CropVIEW, iSCOUT e Modelli malattie.
2.1.2 IMPOSTAZIONI DEL WIDGET
Fare clic su "Altre opzioni" e appariranno altre modifiche. È anche possibile spostare il widget nella Dashboard o rimuoverlo. Inoltre, è possibile raggruppare i dati su base oraria o giornaliera e selezionare l'ultimo periodo di tempo da visualizzare (8h, 24h, 48h, 72h). Se si fa clic sul pulsante "Profilo", è possibile scegliere il tipo di dati tra Tutti i sensori (include tutti i sensori collegati all'METOS) e Tutti i sensori.® ) e gli altri gruppi come Clima delle malattie, Clima di crescita, Monitoraggio del vento, Monitoraggio del gelo e della temperatura Monitoraggio del suolo o delle precipitazioni. Assicurarsi di fare clic sul pulsante "Aggiorna" dopo aver apportato modifiche a tutte le impostazioni, altrimenti le modifiche andranno perse.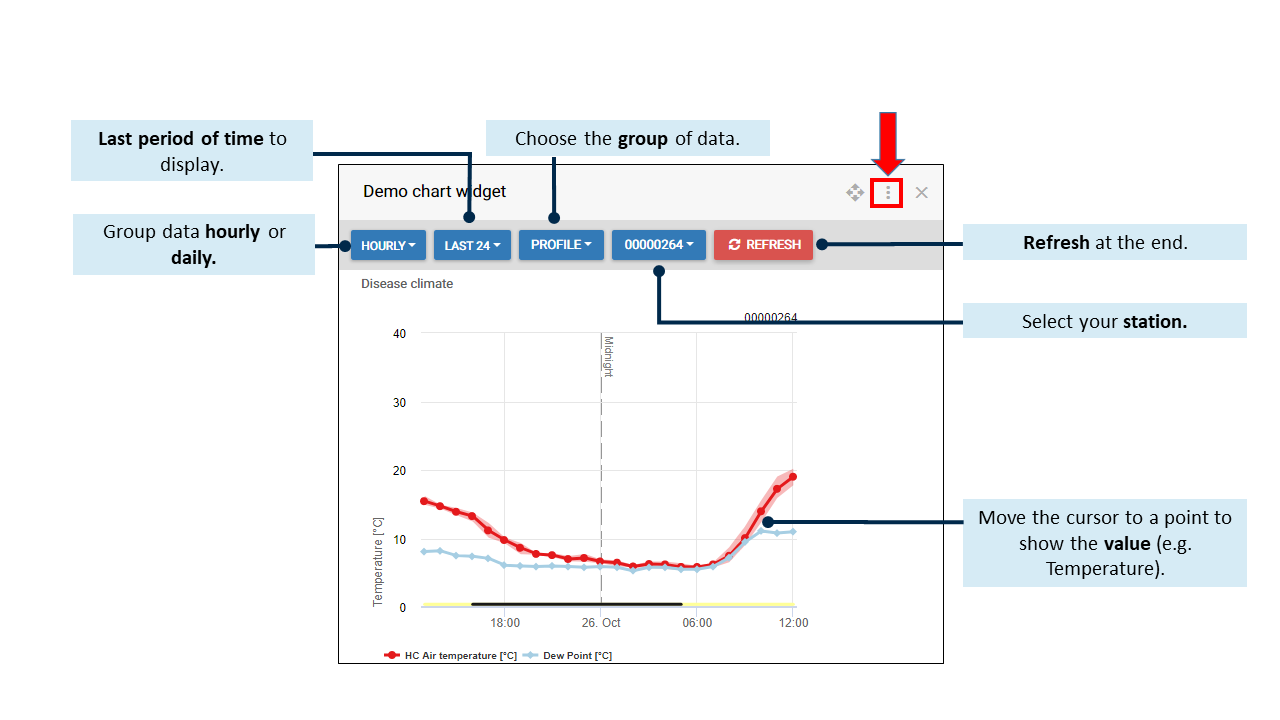
2.2 WIDGET DEL CRUSCOTTO PER L'ELENCO DELLE STAZIONI
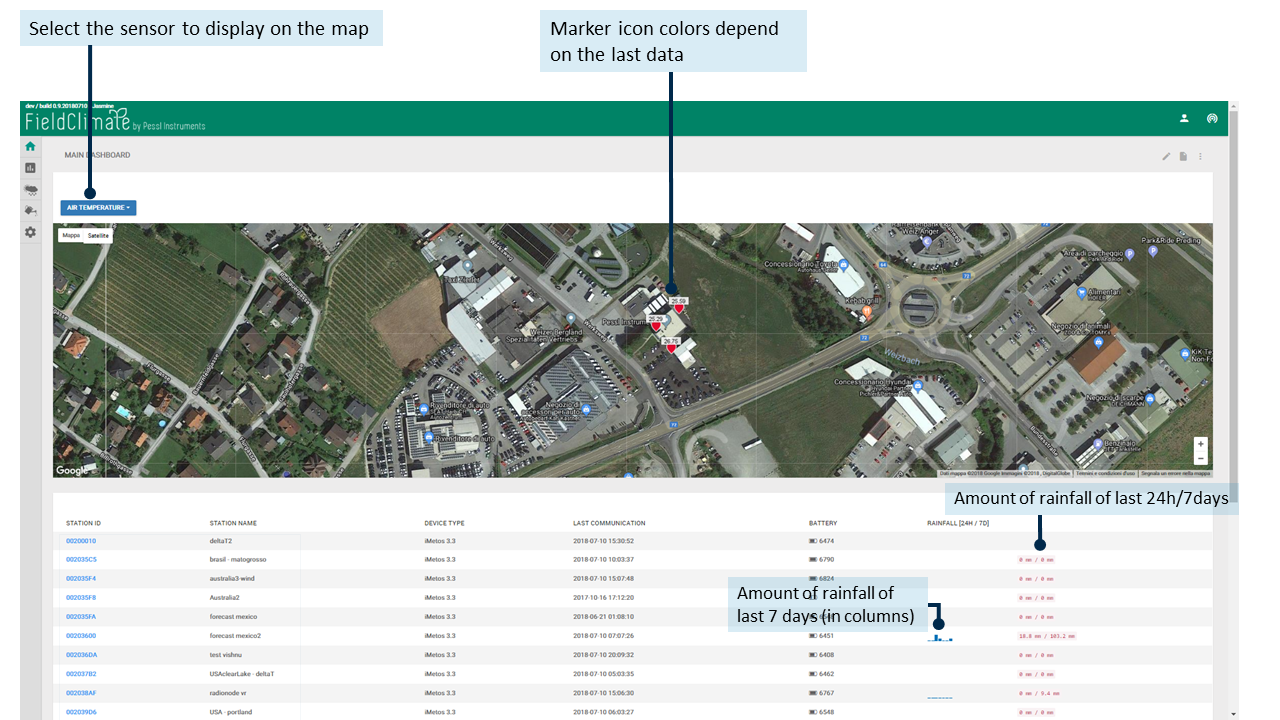
Il widget dell'elenco delle stazioni si trova nella pagina del cruscotto dell'FieldClimate. Con questo strumento, gli utenti possono facilmente valutare le condizioni della stazione per quanto riguarda la batteria, l'ultima comunicazione e altri sensori selezionabili come le precipitazioni, la temperatura dell'aria, ecc. Oltre alla visualizzazione dei dati, è possibile scaricare l'elenco personalizzato in un file excel.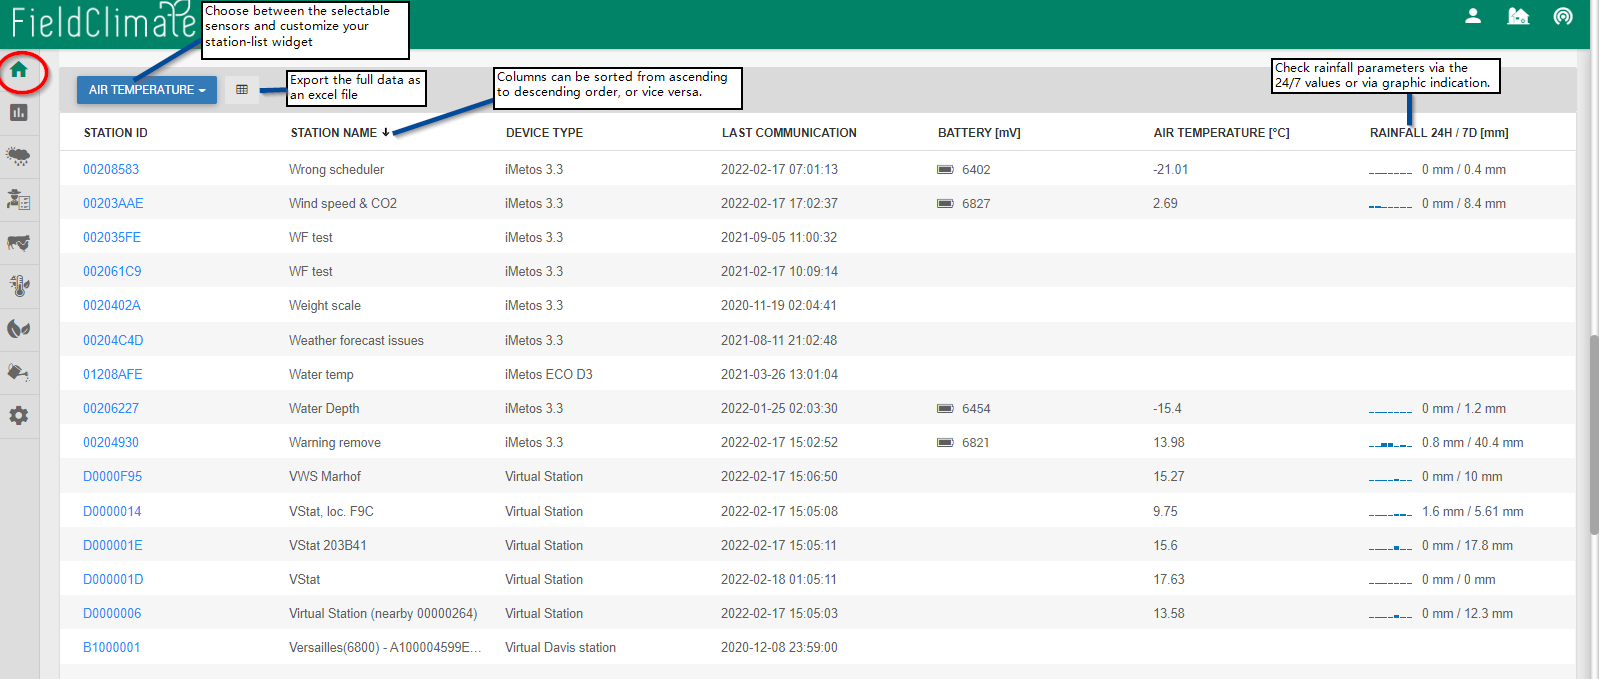
2.3 WIDGET DI MONITORAGGIO DEL LAVORO DEL CRUSCOTTO
I viaggi di Work Tracking possono essere visualizzati e confrontati nella pagina del cruscotto. È possibile creare un widget in Dashboard (tre punti) -> aggiungere un contenitore a 1 colonna -> creare un nuovo widget -> selezionare "Work Tracking" dal menu a discesa -> salvare.2.4 WIDGET DELLA ROSA DEI VENTI DEL CRUSCOTTO
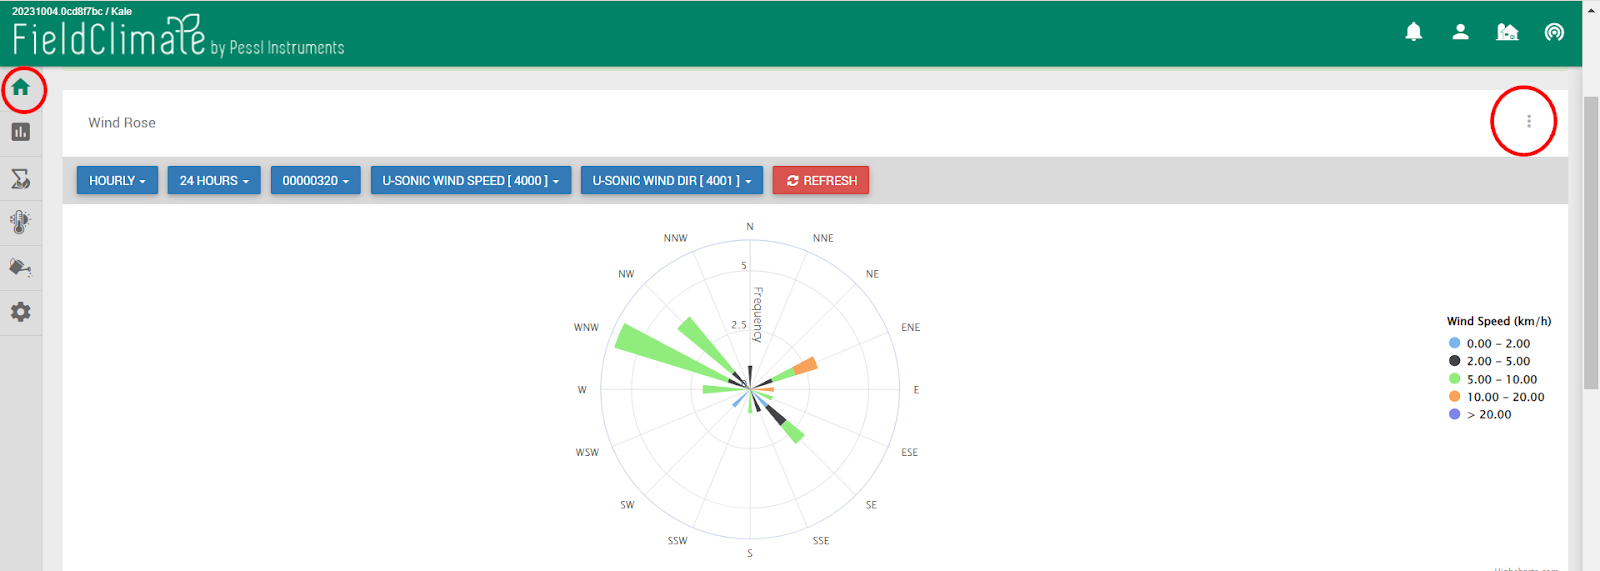
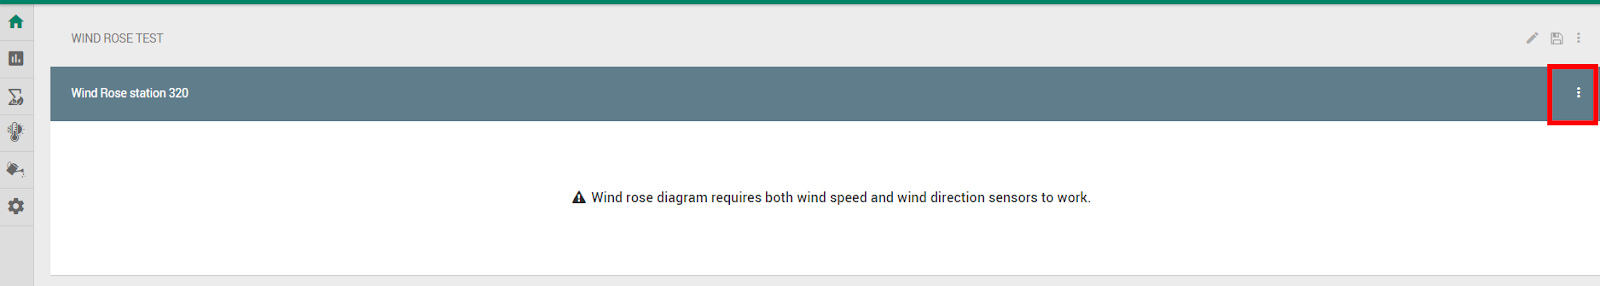
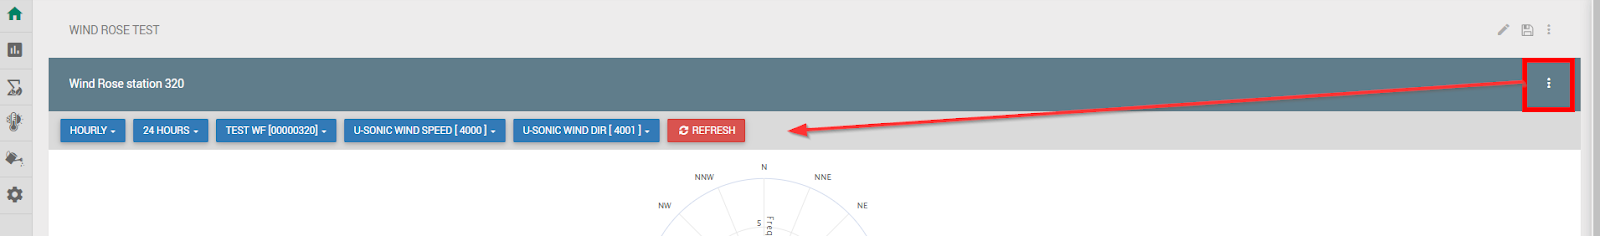
La Rosa dei venti è un grafico che fornisce una visione della distribuzione della velocità e della direzione del vento in un determinato luogo per un periodo di tempo specifico. (direzione e intensità del vento). Per visualizzare la Rosa dei venti, è necessario che i sensori di velocità e direzione del vento siano collegati alla stazione meteorologica METOS. Come interpretare il grafico della Rosa dei Venti? La rosa dei venti rappresenta la direzione del vento prevalente attraverso la lunghezza dei raggi. La semiretta indica la direzione da cui proviene il vento e la sua lunghezza mostra la frequenza di questa direzione. I colori indicano la velocità del vento, il colore più lungo è quello più frequente. Gli intervalli di velocità del vento sono fissi e dipendono dall'unità di misura impostata (km/h, m/s, mph...).- 0-2: la parte blu del raggio indica una velocità del vento calma o molto bassa;
- 2-5: il colore nero indica aria leggera;
- 5-10: i raggi verdi rappresentano una leggera brezza;
- 10-20: il colore arancione rappresenta una leggera brezza;
- >20: il colore viola indica la velocità massima del vento visualizzata nella rosa dei venti.
 Come vedere la rosa dei venti in Fieldclimate?
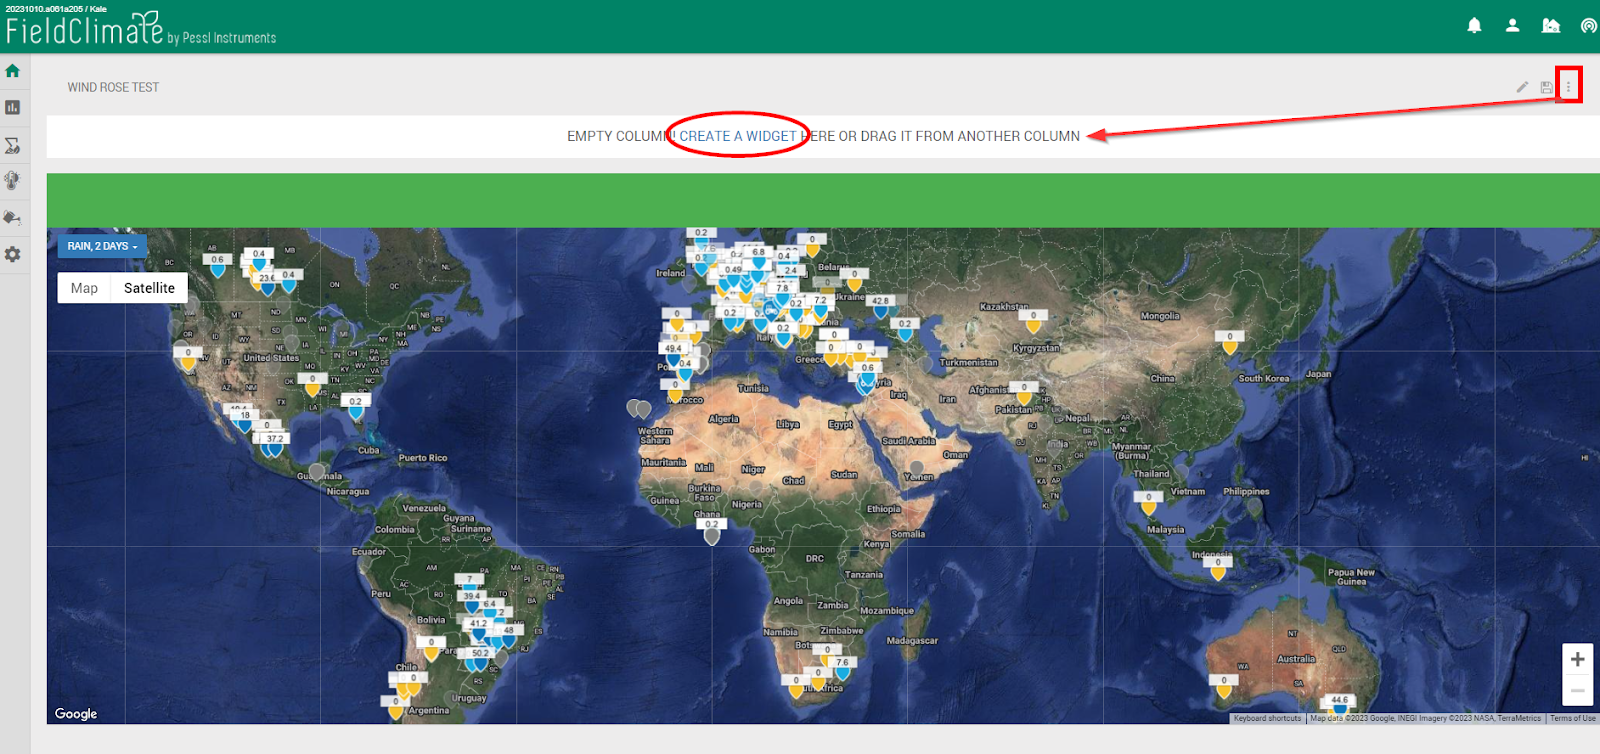
- Fare clic sull'icona con i tre puntini nella dashboard in alto a destra.
- Selezionare una delle opzioni per aggiungere uno o più contenitori di colonne.
- Fare clic su "Crea un widget" e selezionare "Diagramma della Rosa dei Venti".
- Una volta cliccato su "Aggiungi widget" si vedrà il contenitore della rosa dei venti -> per vedere i filtri e il grafico cliccare nuovamente sull'icona con i tre puntini.
- Verranno visualizzati i filtri -> Fonte dei dati (dati grezzi o orari), intervallo di tempo (fino a un massimo di 1 anno di dati misurati), i sensori di velocità e direzione del vento (sono selezionati automaticamente per impostazione predefinita) e la stazione SN deve essere selezionata dall'utente.
- Ricordarsi di SALVARE nell'angolo in alto a destra della dashboard.
3. STRUMENTO ACCUMULATORE
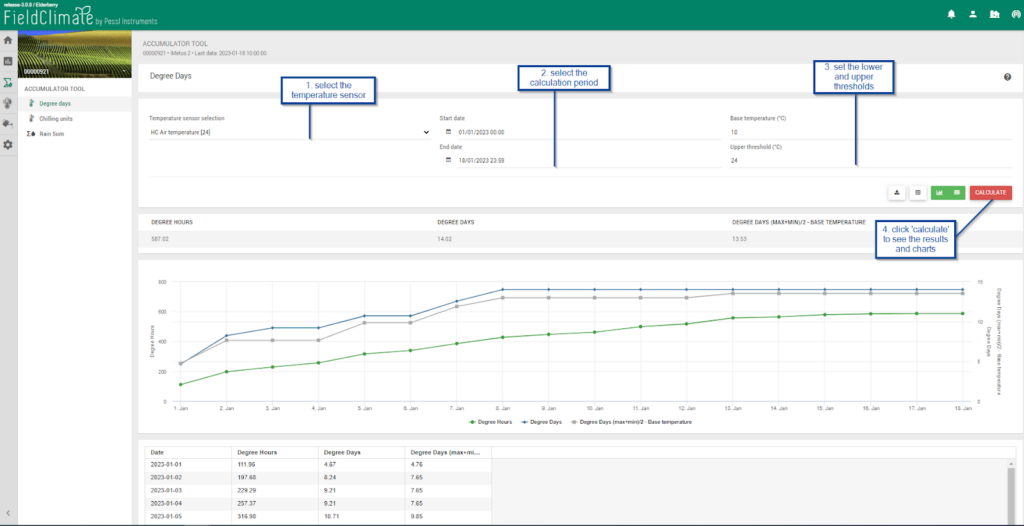
3,1 GRADI GIORNO
3.2 UNITÀ DI RAFFREDDAMENTO
Il modello di Utah è più complesso perché introduce il concetto di efficacia relativa del freddo e di accumulo negativo di freddo (o negazione del freddo). Secondo Richardson et al. (1974) le temperature comprese tra 0 e 16°C favoriscono la rottura del riposo, mentre le temperature > 16°C annullano tali effetti. La massima promozione si verifica a 7°C (1 ora a 7°C = 1 unità di raffreddamento); le temperature più alte e più basse nell'intervallo 0-16°C sono meno efficaci. Questo modello è stato modificato in base alle informazioni disponibili. Il modello Positive Chill Units (PCU) è una modifica del modello Utah, che non considera i valori negativi per l'accumulo di freddo e che è stato progettato per situazioni in cui, a causa dell'abbondanza di alte temperature invernali (temperature > 16 °C), i valori finali sono negativi. Questo modello è risultato in grado di fornire una stima più accurata del freddo invernale in aree con inverni miti o climi subtropicali.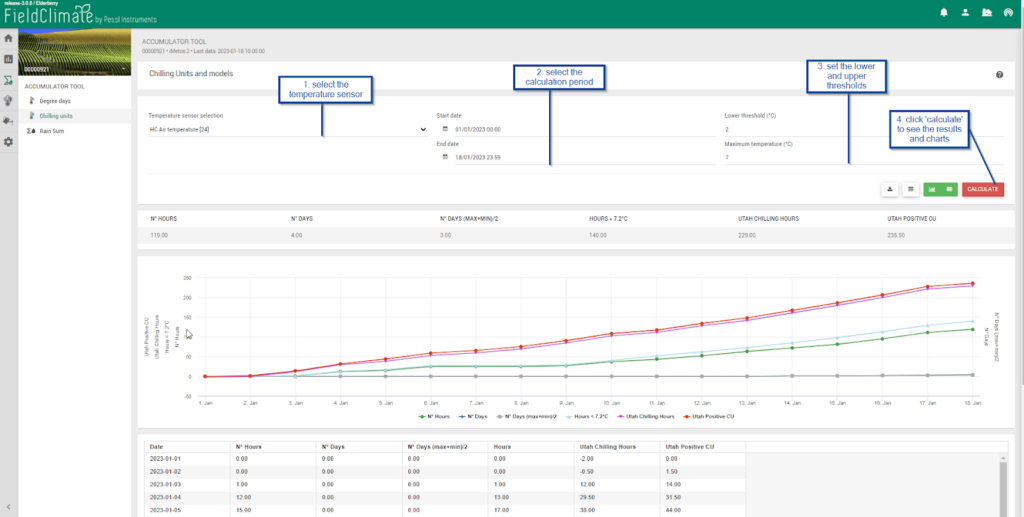
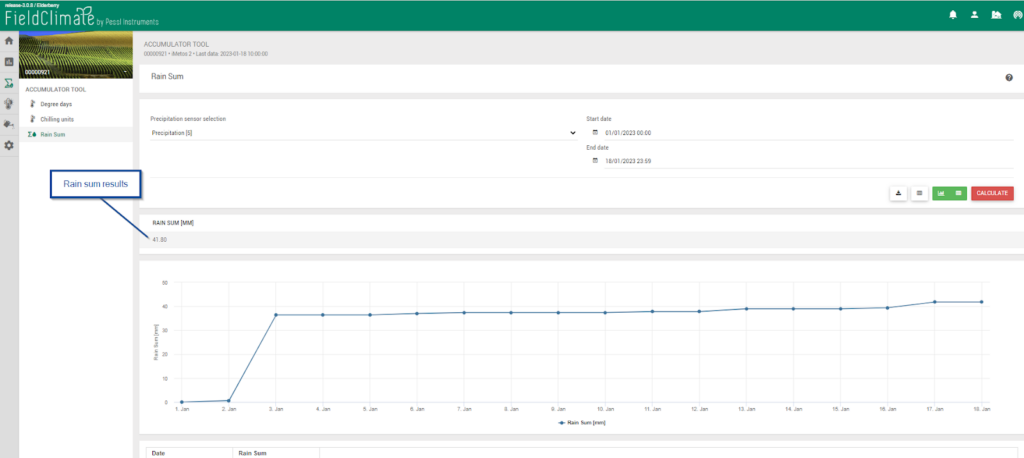
3.3 SOMMA DELLA PIOGGIA
4. PAGINA DELLE PREVISIONI DEL TEMPO
Per iMETEO è necessario che sia attivo l'abbonamento corrispondente. È un prodotto congiunto di meteoblue e Pessl Instruments. Combina i dati passati con una previsione delle principali variabili meteorologiche su base oraria per 7 giorni. Un METOS® è necessario: i dati dell'osservazione vengono inviati alla stazione www.fieldclimate.com/login e le previsioni del tempo vengono automaticamente adattate alle condizioni dello specifico METOS® stazione meteorologica. I dati possono essere combinati con modelli di previsione delle condizioni di irrorazione, crescita, irrigazione e malattie. Nella pagina Previsioni meteo è possibile scegliere diversi modi per visualizzare le previsioni del tempo sul proprio sito. Dettagli: Previsioni meteo a 3 giorni come impostazione predefinita, ma è possibile visualizzare anche i 7 giorni successivi. Parametri calcolati ogni ora: temperatura dell'aria (°C), precipitazioni (mm), probabilità di precipitazioni (%), direzione del vento (deg), velocità e raffica del vento (m/s), umidità relativa (%), evapotraspirazione giornaliera (mm), bagnatura delle foglie, radiazione solare globale (W/m^2), copertura nuvolosa (%), pressione atmosferica superficiale (hPa).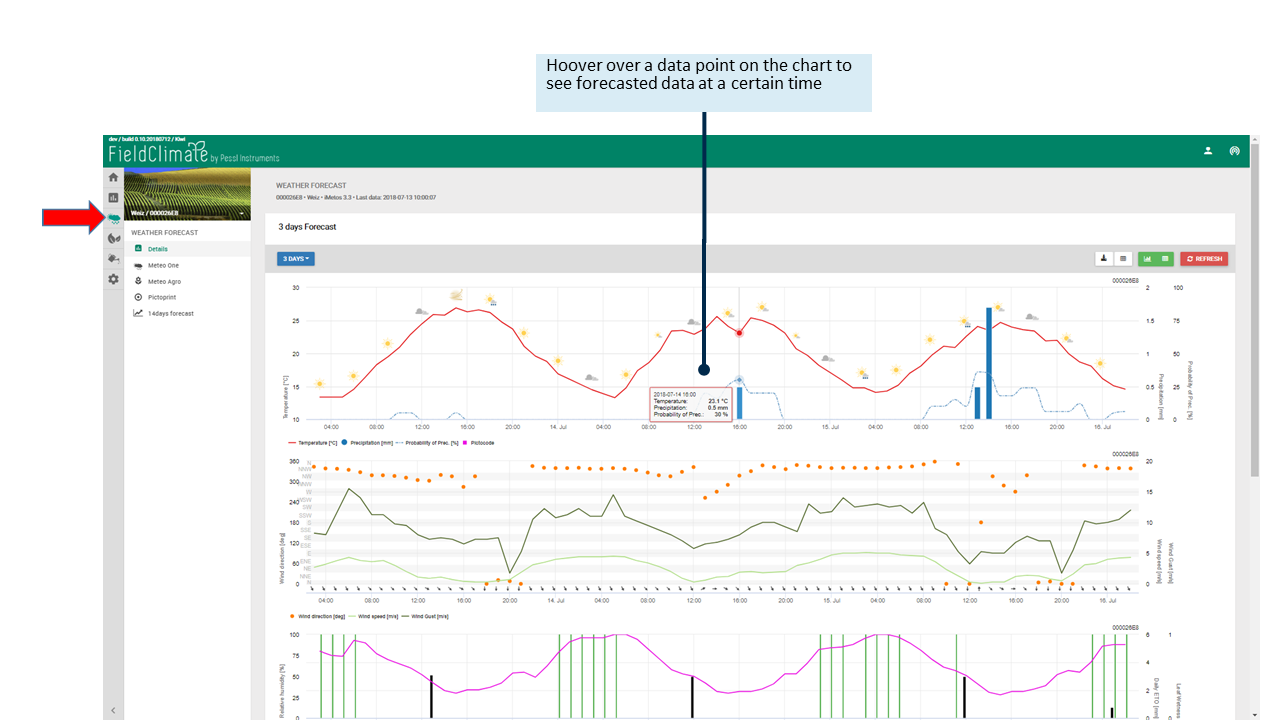
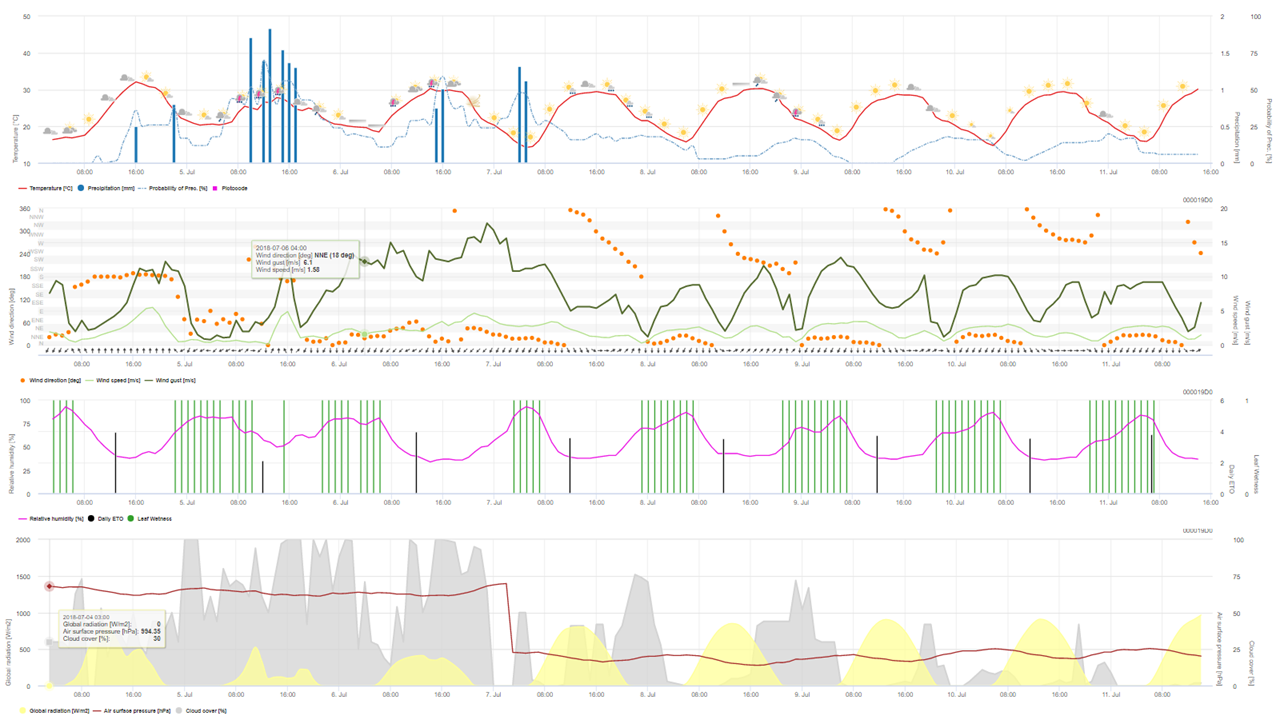 La direzione del vento in gradi è visualizzata da punti arancioni, mentre in basso una freccia aiuta a capire meglio il flusso del vento. Nel rettangolo (tootlip) sono disponibili dati dettagliati in tutti i grafici.
Si noti che ET0 è un calcolo giornaliero.
Nell'ultimo grafico, la pressione atmosferica si riferisce all'altitudine della stazione, mentre la radiazione solare globale e la copertura nuvolosa totale si riferiscono alla porzione di cielo sopra la stazione.
Meteo One: previsioni meteo localizzate a 7 giorni con tutti i dati meteorologici.
Meteo Agro: previsioni meteo localizzate a 7 giorni con informazioni agronomiche, finestra fitosanitaria.
La direzione del vento in gradi è visualizzata da punti arancioni, mentre in basso una freccia aiuta a capire meglio il flusso del vento. Nel rettangolo (tootlip) sono disponibili dati dettagliati in tutti i grafici.
Si noti che ET0 è un calcolo giornaliero.
Nell'ultimo grafico, la pressione atmosferica si riferisce all'altitudine della stazione, mentre la radiazione solare globale e la copertura nuvolosa totale si riferiscono alla porzione di cielo sopra la stazione.
Meteo One: previsioni meteo localizzate a 7 giorni con tutti i dati meteorologici.
Meteo Agro: previsioni meteo localizzate a 7 giorni con informazioni agronomiche, finestra fitosanitaria.
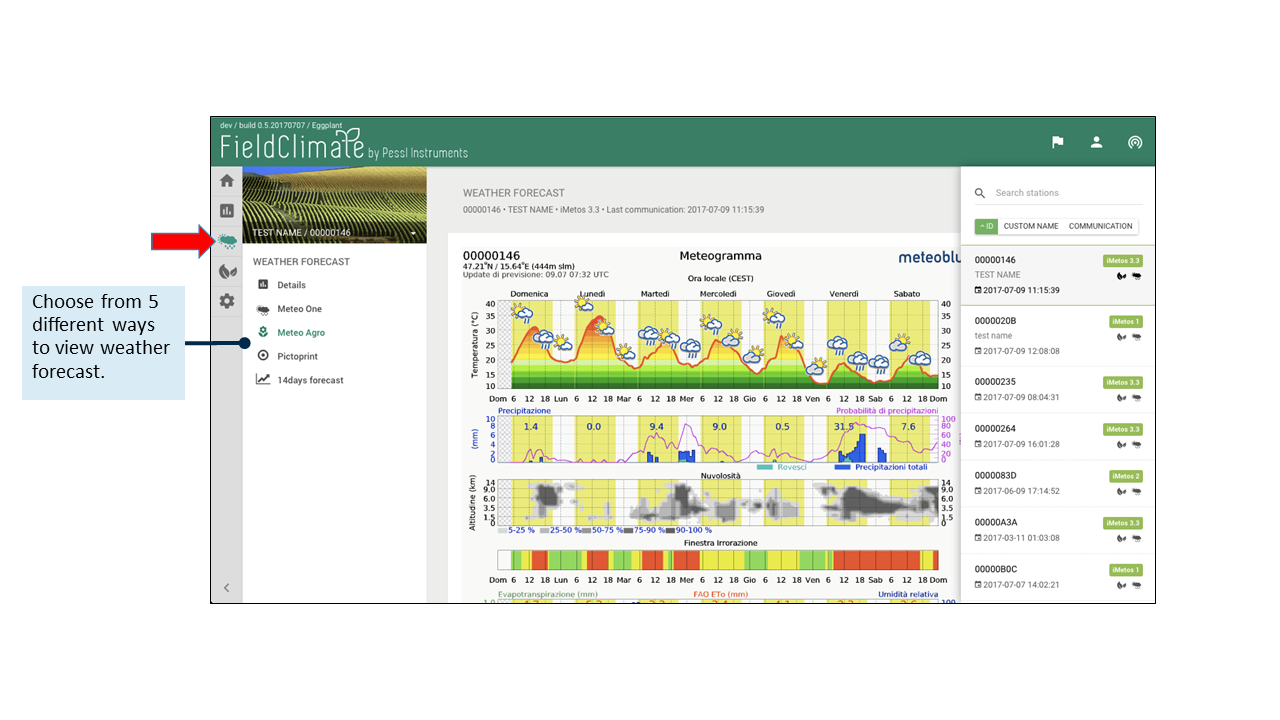 Pictoprint: previsioni meteo localizzate per 7 giorni con rainSPOT (15 km di distanza).
Previsioni localizzate a 14 giorni.
Pictoprint: previsioni meteo localizzate per 7 giorni con rainSPOT (15 km di distanza).
Previsioni localizzate a 14 giorni.
4.1 STORIA E CLIMA
All'interno di questa nuova pagina è presente un'ampia gamma di funzionalità incentrate sui dati meteorologici e climatici storici. Di seguito è riportata una panoramica di queste funzionalità.4.1.1 VALUTAZIONE DEL RISCHIO
Il diagramma di valutazione del rischio mostra la probabilità che un evento meteorologico o un rischio specifico si verifichi durante un anno. I diagrammi sono disponibili per 1) eventi freddi, 2) eventi caldi e 3) precipitazioni e si basano su oltre 30 anni di dati storici di simulazione. Confrontando anni diversi, è possibile individuare modelli di eventi specifici. Questo diagramma aiuta a prendere decisioni che dipendono dalle condizioni meteorologiche, come le attività all'aperto o i periodi di semina. Il diagramma di valutazione del rischio è suddiviso in 3 parti:- Probabilità: Il primo diagramma mostra la probabilità di un determinato evento in percentuale (%). L'asse delle ordinate indica la probabilità, mentre l'asse delle ascisse mostra l'arco temporale per tutti i diagrammi.
- Rischio tollerabile: Il rischio tollerabile si avvicina al rischio personale tollerabile in percentuale (%). Ciò consente di valutare il rischio tenendo conto delle divergenze che sono personalmente accettabili. L'asse y indica il rischio tollerabile in percentuale.
- Anni: Il terzo diagramma confronta gli eventi degli ultimi 40 anni. L'asse delle ordinate mostra i diversi anni. Questo aiuta a differenziare le stagioni e a valutare la probabilità di un determinato evento.
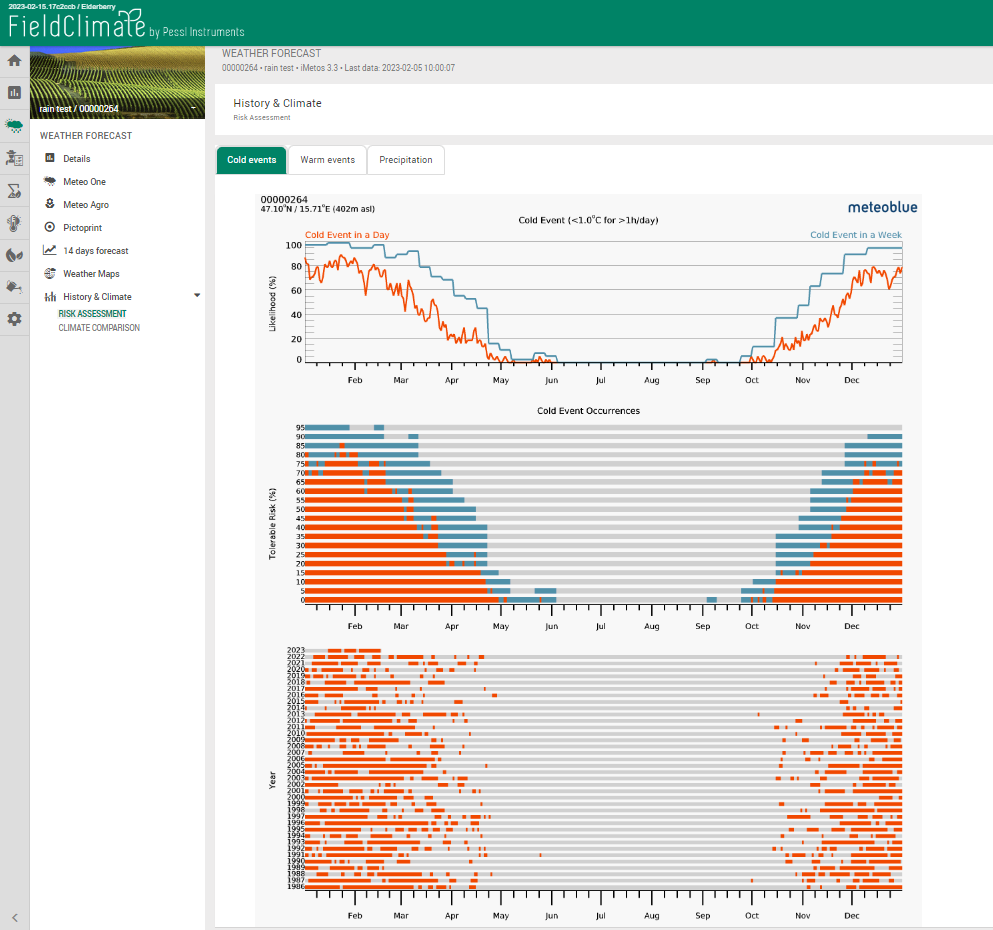
4.1.1.A EVENTI FREDDI E CALDI
La temperatura è inferiore o superiore a una determinata soglia per un certo periodo di tempo. La soglia è impostata su valori di temperatura di 1°C per gli eventi freddi e di 30°C per gli eventi caldi. Il meteogramma degli eventi freddi è comunemente usato per valutare il gelo. Il primo diagramma mostra la probabilità dell'evento definito. Nel secondo diagramma è possibile stimare il proprio rischio personale. Ad esempio, se il vostro rischio personale di gelo è di 20%, dovreste programmare la semina più tardi (ad esempio, a fine aprile). D'altra parte, se si può accettare una probabilità di gelo di 50% a favore di una semina più precoce, si dovrebbe seminare prima (ad esempio, all'inizio di marzo).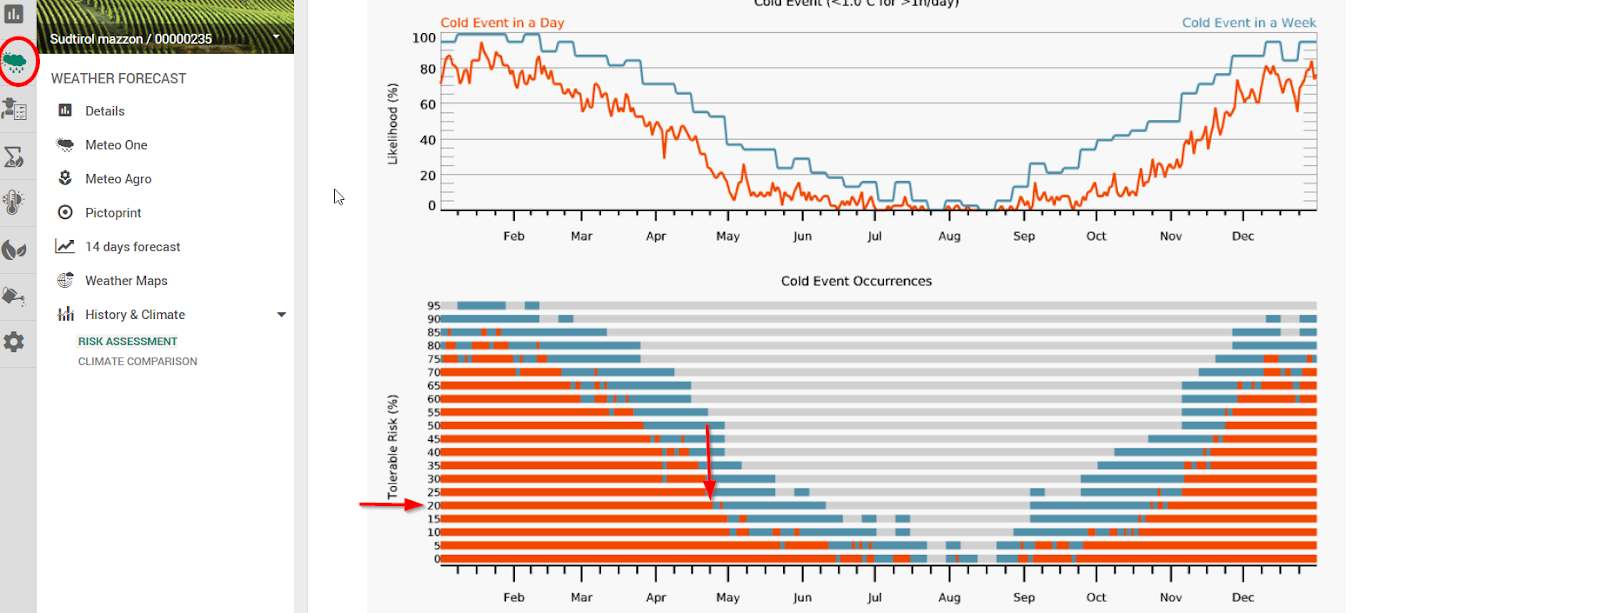
4.1.1.B PRECIPITAZIONE
Questa variabile valuta le quantità di precipitazioni in una settimana al di sopra di una certa soglia e con l'aiuto di questa rappresentazione è possibile stimare forti eventi di precipitazione e programmare le attività di conseguenza. La soglia per le precipitazioni è fissata a 30 mm/settimana.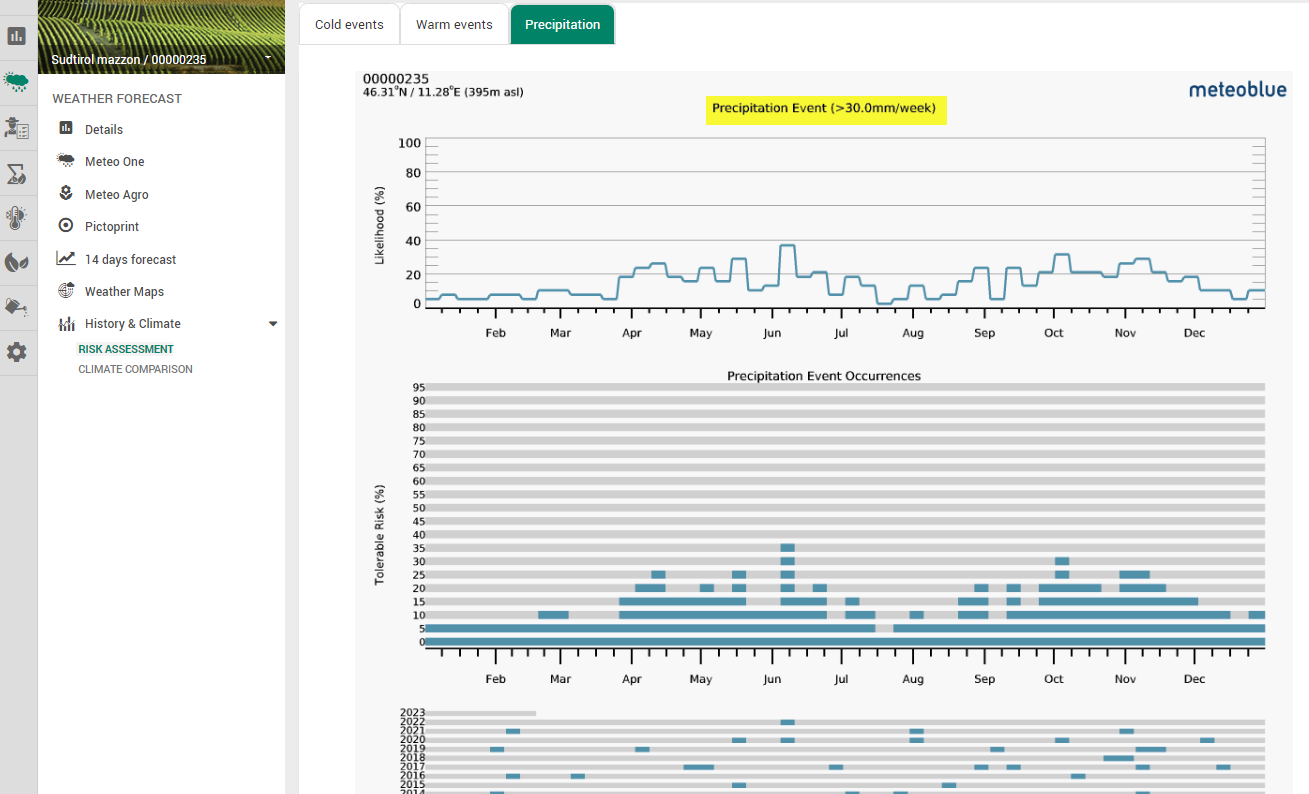
4.1.2 CONFRONTO CLIMATICO
4.1.2.A METEOGRAMMA DEI PROSSIMI 6 GIORNI
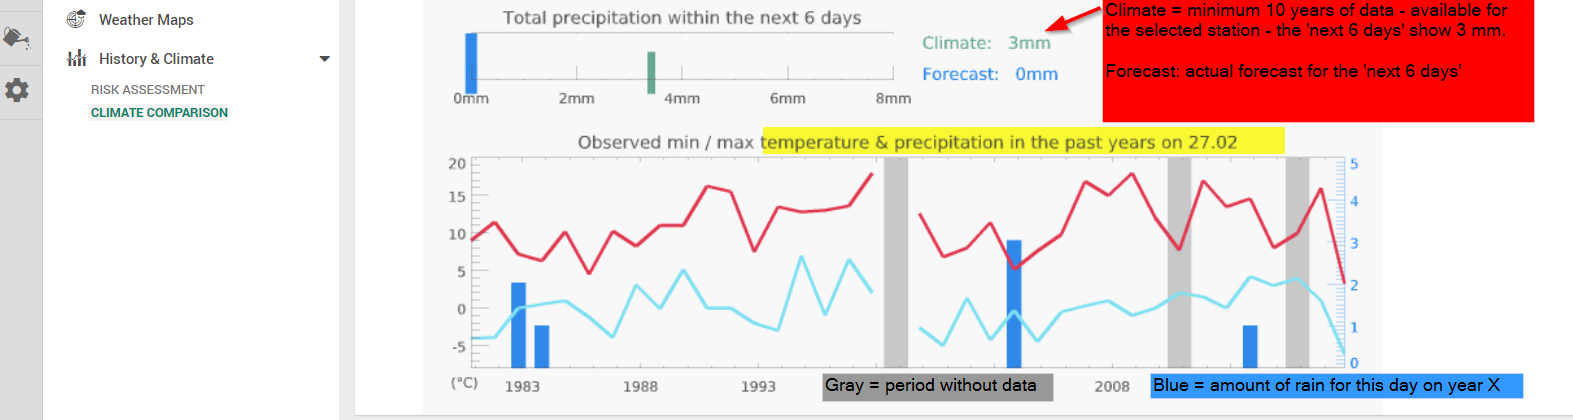
Il meteogramma Confronto climatico mostra il tempo previsto, confrontato con il tempo degli ultimi 10 o più anni. In questo modo è possibile capire quanto sia "normale" il tempo attuale. Il meteogramma Confronto climatico cerca il luogo più vicino che dispone di una stazione meteorologica con almeno 10 anni di misurazioni affidabili. Il nome del luogo con la stazione è indicato nel titolo del meteogramma, così come la distanza dal luogo selezionato. Il temperatura Il grafico mostra l'intervallo delle temperature massime, medie (linea sottile) e minime degli ultimi anni e le previsioni per i prossimi 6 giorni (linea spessa). Il totale precipitazione per i prossimi giorni è mostrato nel grafico delle precipitazioni, rispetto alla media delle precipitazioni del periodo negli ultimi anni.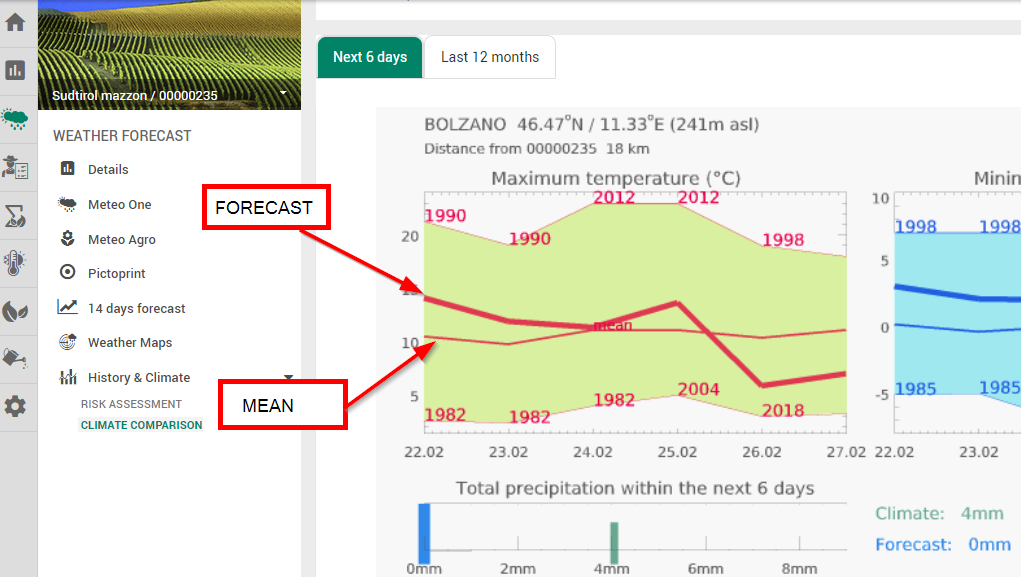 Il grafico climatico mostra la temperatura e le precipitazioni della data attuale, misurate alla stessa data nella stazione negli anni passati. Gli anni senza misurazioni sono contrassegnati da una barra grigia.
Per il grafico climatico, viene selezionata automaticamente la stazione meteorologica più vicina, per la quale sono disponibili misurazioni affidabili su 30 anni. Nelle zone collinari, questa stazione può trovarsi a un'altitudine diversa rispetto al luogo selezionato. Pertanto, il diagramma climatico mostra le misure e le previsioni per questa stazione e non per la località selezionata.
Il grafico climatico mostra la temperatura e le precipitazioni della data attuale, misurate alla stessa data nella stazione negli anni passati. Gli anni senza misurazioni sono contrassegnati da una barra grigia.
Per il grafico climatico, viene selezionata automaticamente la stazione meteorologica più vicina, per la quale sono disponibili misurazioni affidabili su 30 anni. Nelle zone collinari, questa stazione può trovarsi a un'altitudine diversa rispetto al luogo selezionato. Pertanto, il diagramma climatico mostra le misure e le previsioni per questa stazione e non per la località selezionata.
4.1.2.B METEOGRAMMA DEI PROSSIMI 12 GIORNI - DA CORRENTE A CLIMA
Il meteogramma "Ultimi 12 mesi" consente di confrontare le variabili meteorologiche della stagione in corso con la media climatica di 30 anni. clima. Questo diagramma mostra la stagione attuale rispetto al clima medio di un luogo scelto. Il diagramma è etichettato con temperatura e mesi.- La linea nera mostra la temperatura media per ogni mese degli ultimi 12 mesi (corrente).
- La linea arancione spessa mostra la temperatura media calcolata degli ultimi 30 anni per ogni mese (clima). Questa linea indica la media esatta delle temperature, ma non rivela le fluttuazioni della temperatura da un anno all'altro.
- Il buffer arancione intorno alla linea rossa rende più visibili le fluttuazioni tra gli ultimi 30 anni. Mostra in quale intervallo sono distribuite le temperature degli ultimi 30 anni. Mostra la media mensile massima e la media mensile minima degli ultimi 30 anni.
- Più ampio è il buffer intorno alla linea rossa, più le fluttuazioni tra gli anni sono comuni in questo mese.
- Se la linea nera corre al di fuori del buffer arancione, significa che la temperatura del mese o della stagione in corso non corrisponde alla temperatura media abituale prevista in questo luogo.
- Se la linea nera si trova all'interno del buffer arancione, significa che le temperature attuali corrispondono al clima abituale.
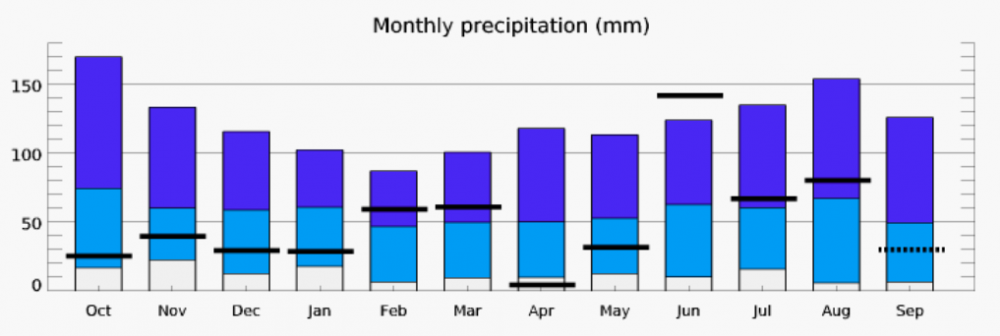 Precipitazioni mensili
Il diagramma per il mensile precipitazione mostra la quantità di precipitazioni per ogni mese degli ultimi 12 mesi rispetto alle precipitazioni degli ultimi 30 anni. Il grafico è etichettato con i millimetri e i mesi.
Precipitazioni mensili
Il diagramma per il mensile precipitazione mostra la quantità di precipitazioni per ogni mese degli ultimi 12 mesi rispetto alle precipitazioni degli ultimi 30 anni. Il grafico è etichettato con i millimetri e i mesi.
- Le barre orizzontali nere mostrano le precipitazioni registrate per ogni mese corrente.
- Le barre blu scuro mostrano la quantità massima di precipitazioni degli ultimi 30 anni per ogni mese.
- Le barre blu chiaro mostrano la quantità minima di precipitazioni negli ultimi 30 anni.
- Le barre bianche mostrano la quantità minima di precipitazioni negli ultimi 30 anni.
- Se una barra nera si trova sotto la barra blu chiaro o sopra la barra blu scuro, significa che l'attuale somma mensile delle precipitazioni non corrisponde alla media trentennale.
- Più lunghe sono le barre blu, maggiori sono le fluttuazioni delle precipitazioni mensili tra gli ultimi 30 anni.
- Più corte sono le barre blu, meno fluttuazioni ci sono state negli ultimi 30 anni, il che significa che la quantità di precipitazioni è stata più costante.
5. PAGINA DI PIANIFICAZIONE DEL LAVORO
Si potrà accedere a questa pagina solo se si è attivato l'abbonamento alle previsioni del tempo. Pessl Instruments ha sviluppato negli ultimi 6 anni una serie di algoritmi di pianificazione del lavoro basati sulla combinazione di misurazioni reali di pioggia e temperatura e di previsioni meteorologiche orarie a 7 giorni. Le informazioni di servizio basate sulle previsioni di lavoro sono disponibili con risoluzione oraria per i prossimi 7 giorni. Gli algoritmi di pianificazione del lavoro indicano il periodo più adatto (colore verde) e quello peggiore (colore rosso), con più intervalli intermedi, per eseguire e pianificare l'operazione richiesta nel vostro campo specifico. Accessibilità al campo e Capacità di lavorazione del terreno si basano sulle precipitazioni e mostrano i periodi migliori e peggiori per accedere e lavorare sul campo. Efficienza di concimazione è calcolato in base alle raffiche di vento, alle precipitazioni e all'umidità relativa e indica in colore verde il periodo più adatto per spargere il fertilizzante. Ulteriori informazioni sono disponibili nella Guida in linea. Qui di seguito un esempio della finestra Efficienza di concimazione in Accesso FieldClimate. Questi servizi sono tutti visualizzati nel primo grafico, mentre il secondo mostra le previsioni del tempo corrispondenti.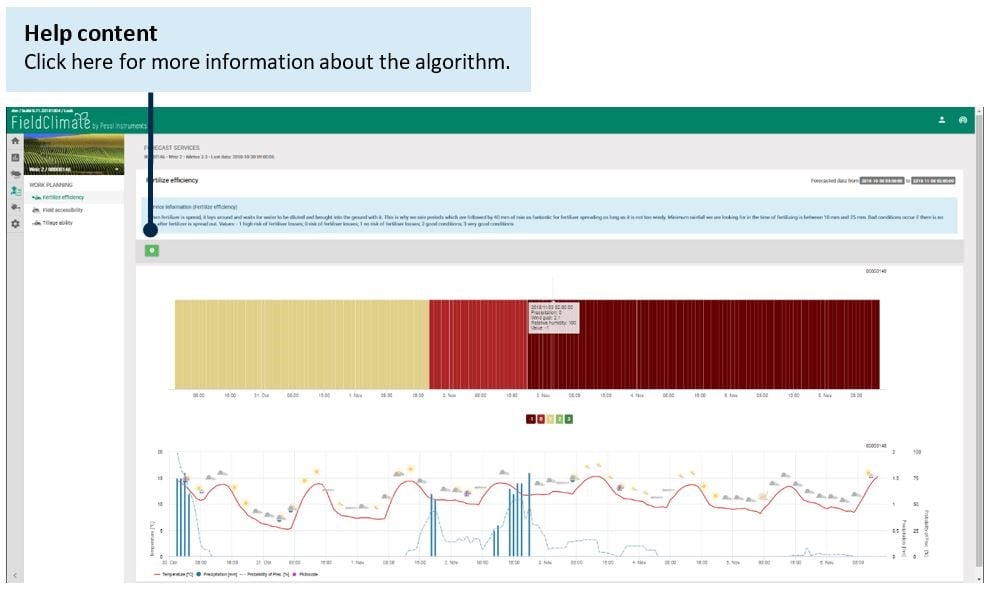
5.1 FINESTRA DI SEMINA TROPICALE
Questo modello stima l'idoneità generale alla semina per le colture coltivate in ambiente tropicale. Il modello prende in considerazione le precipitazioni misurate, così come le previsioni di precipitazione, e la temperatura. I periodi di semina adatti saranno contrassegnati dal colore verde (punteggio: 2). Tuttavia, temperature massime troppo elevate nelle previsioni, precipitazioni complessivamente scarse o previsioni di precipitazioni orarie estremamente elevate sono sfavorevoli e, pertanto, sono contrassegnate come condizioni di semina meno adatte (giallo, 1) o inadatte (rosso, 0).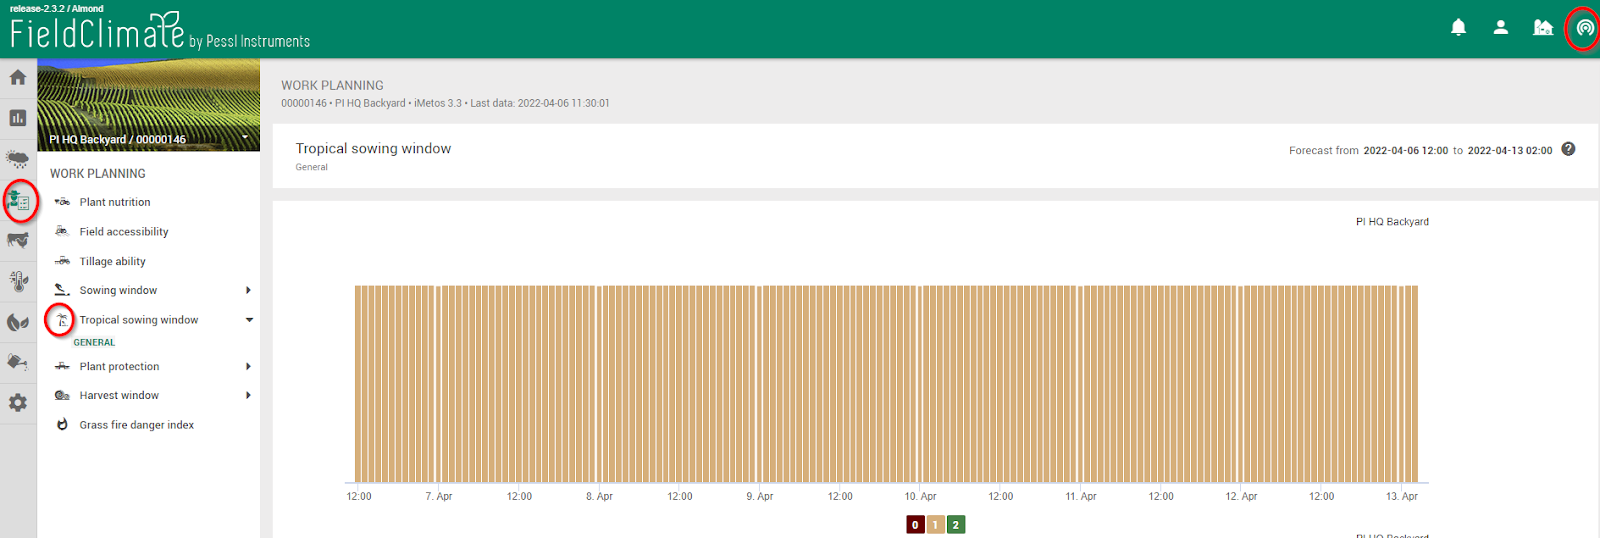
6. PAGINA DI MONITORAGGIO DELLE CONDIZIONI METEOROLOGICHE ESTREME
La pagina di monitoraggio dei fenomeni meteorologici estremi serve come strumento di protezione per le ondate di gelo e di calore, tenendo sotto controllo i dati misurati e quelli previsti sullo stesso grafico, consentendo una rapida valutazione della situazione attuale, per individuare i rischi e prevenire i danni alle colture e alla salute della popolazione. Il grafico include per impostazione predefinita:- 48 ore di dati misurati in passato di temperatura dell'aria, temperatura di bulbo umido e secco.
- Previsione iperlocalizzata a 48 ore della temperatura dell'aria e della temperatura di bulbo umido aggiornata frequentemente con gli ultimi dati della vostra stazione, del satellite e del radar.
- Disponibile per i sensori: temperatura di bulbo umido, temperatura di bulbo secco (solo dati misurati) e temperatura dell'aria.
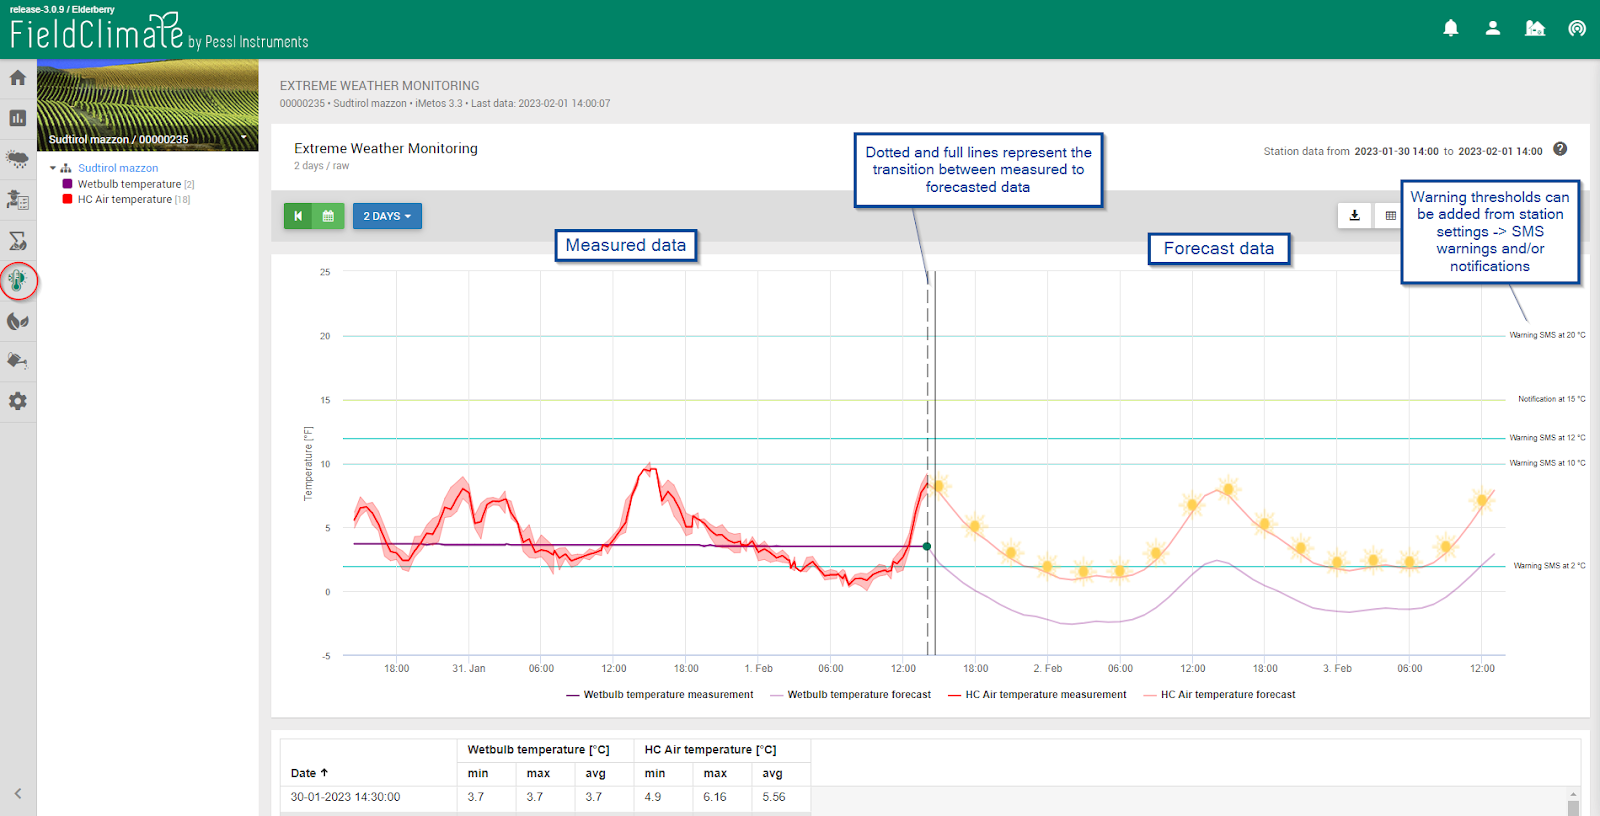 Qual è il ruolo della temperatura di bulbo umido e secco per la protezione dal gelo?
Il sensore di temperatura secca segue con maggiore precisione la temperatura della pianta durante le notti serene, mentre la temperatura del bulbo umido può essere utilizzata per stimare il potenziale di gelo e determinare il momento migliore per accendere gli irrigatori per la protezione dal gelo.
Qual è il ruolo della temperatura di bulbo umido e secco per la protezione dal gelo?
Il sensore di temperatura secca segue con maggiore precisione la temperatura della pianta durante le notti serene, mentre la temperatura del bulbo umido può essere utilizzata per stimare il potenziale di gelo e determinare il momento migliore per accendere gli irrigatori per la protezione dal gelo.
7. PAGINA DEI MODELLI DI MALATTIA
Una volta scelta la stazione, selezionare la coltura e il modello di malattia corrispondente. Nel menu in alto, come spiegato nel capitolo Dati della stazione, scegliere il lasso di tempo in cui visualizzare il grafico/tabella. Poi si può cliccare su "Informazioni sul modello di malattia" per avere maggiori informazioni sul grafico di ciascuna malattia. I grafici e le tabelle mostrano, ad esempio, il rischio di malattia (%), l'andamento dell'infezione (%), che sono di fondamentale importanza per il processo decisionale dell'agricoltore. I dati vengono visualizzati ogni ora ed è possibile selezionare l'ultimo periodo di tempo (da 24 ore a 30 giorni) o il periodo di tempo dal calendario. È anche possibile esportare i dati come immagine o csv, visualizzarli in un grafico o in una tabella e alla fine ricordarsi di aggiornarli.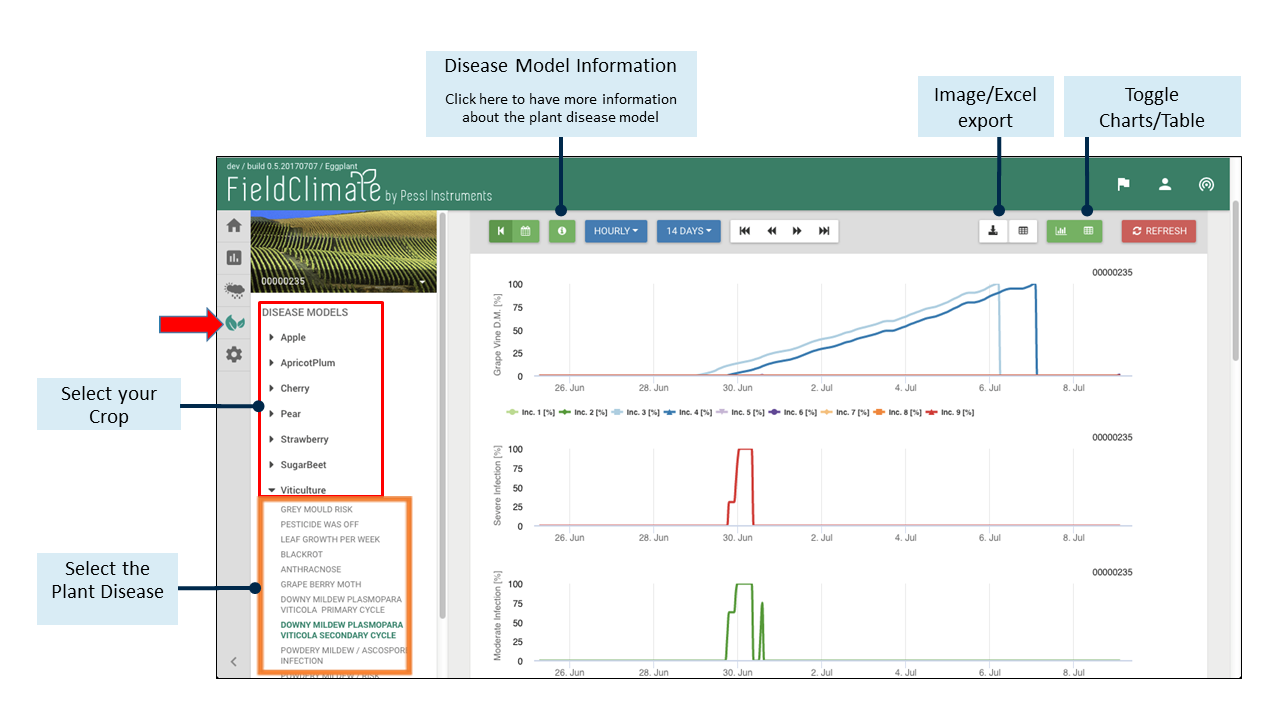 Se desiderate saperne di più e avere informazioni più dettagliate sul nostro Sistema di Supporto alla Malattia visitate il sito questo sito web.
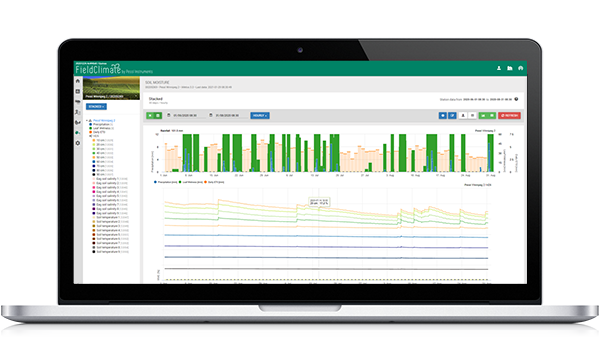
8. PAGINA SULL'UMIDITÀ DEL SUOLO
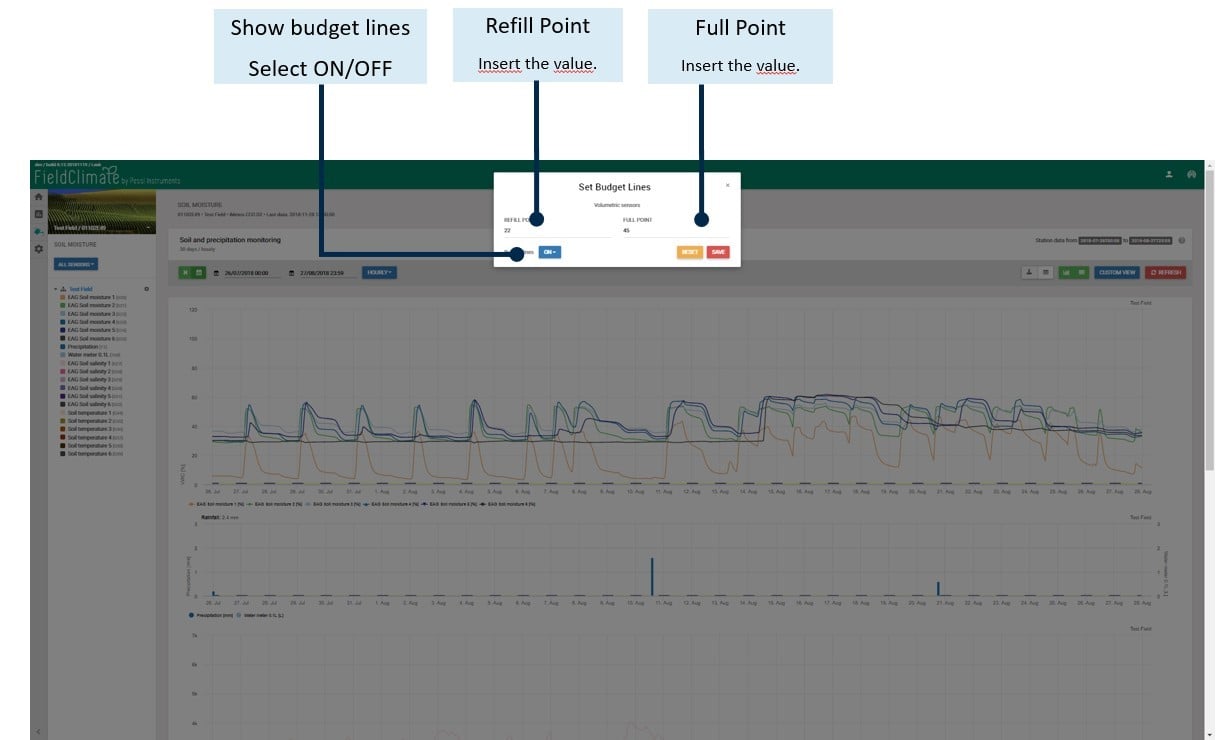
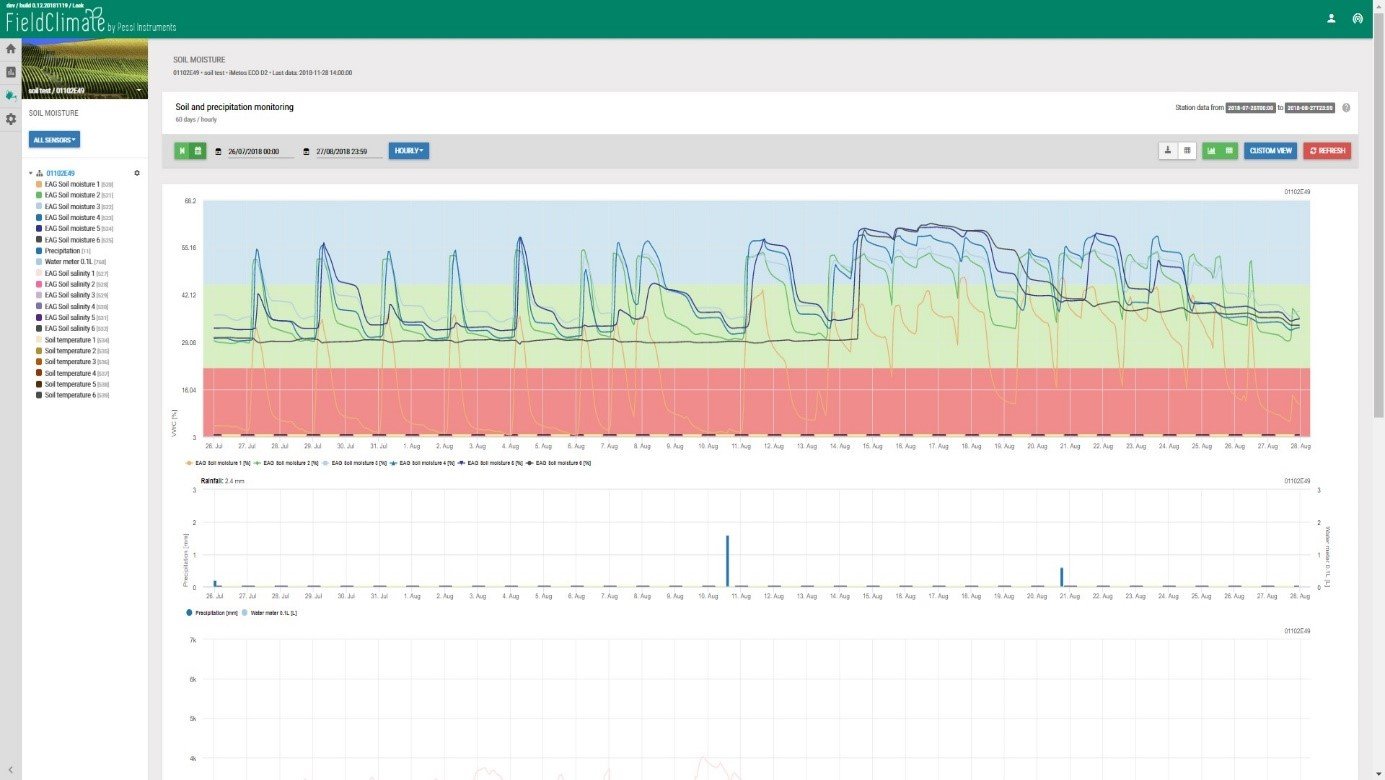
In questa pagina sono elencati tutti i sensori di umidità del terreno collegati all'METOS.® che i dati vengono visualizzati nei grafici. Sul lato sinistro si trovano tutti i sensori e si possono selezionare solo quelli di interesse. Nel menu superiore è possibile scegliere il periodo di tempo per la visualizzazione dei dati, ricordandosi poi di aggiornare. È possibile impostare le linee di bilancio per applicare le bande colorate nel grafico che indicano le diverse condizioni di umidità.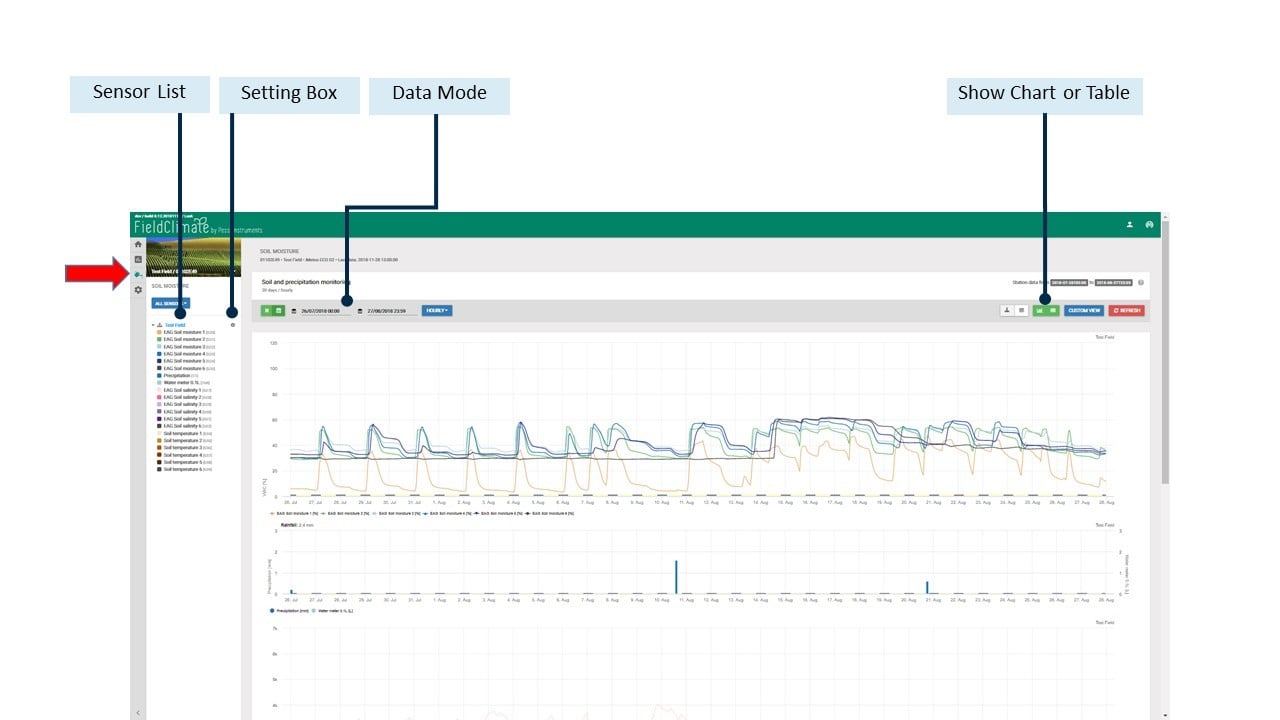 Per accedere alla casella delle impostazioni, è necessario fare clic sull'icona delle impostazioni nel menu di sinistra. Ricordarsi di selezionare l'opzione "Mostra bande". È possibile impostare il Punto di ricarica e il Punto di riempimento; assicurarsi alla fine di fare clic su "Salva configurazione", altrimenti le modifiche andranno perse.
Per i diversi nodi è possibile configurare le impostazioni separatamente.
Per accedere alla casella delle impostazioni, è necessario fare clic sull'icona delle impostazioni nel menu di sinistra. Ricordarsi di selezionare l'opzione "Mostra bande". È possibile impostare il Punto di ricarica e il Punto di riempimento; assicurarsi alla fine di fare clic su "Salva configurazione", altrimenti le modifiche andranno perse.
Per i diversi nodi è possibile configurare le impostazioni separatamente.
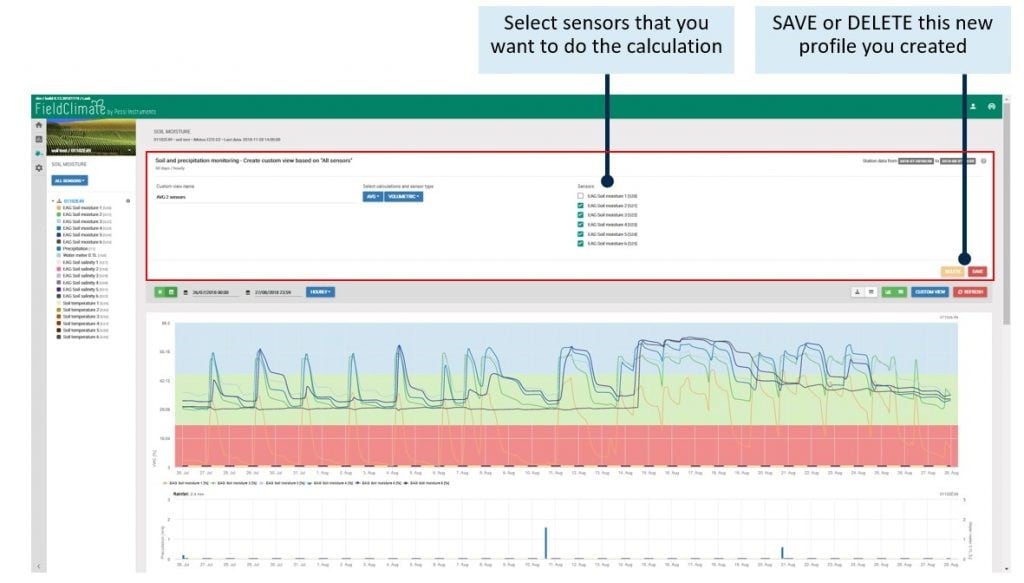
8.1 VISTA PERSONALIZZATA
Fare clic su "VISTA PERSONALIZZATA"; scrivere il nome della vista personalizzata, selezionare il tipo di calcolo (AVG, SUM o PAW) e il sensore (volumetrico o tensiometrico), quindi selezionare i sensori che si desidera calcolare. Non dimenticare di salvare alla fine.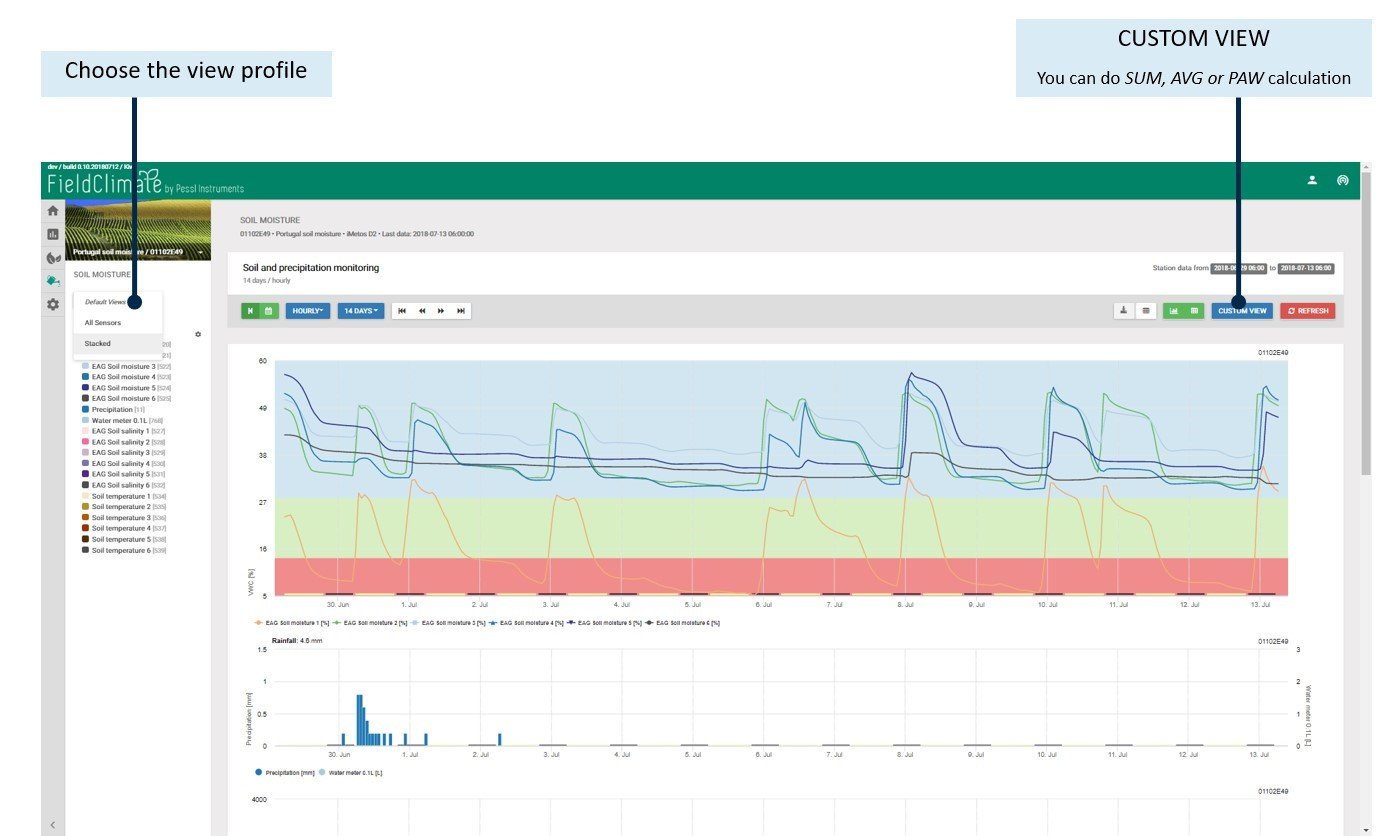
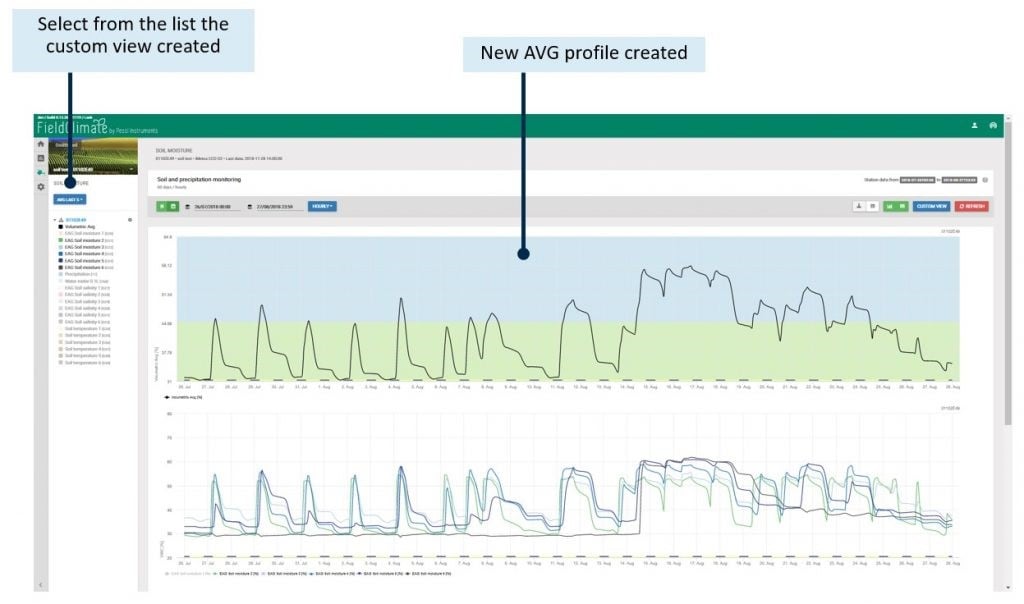
8.1.1 MEDIA
8.1.2 SOMMA
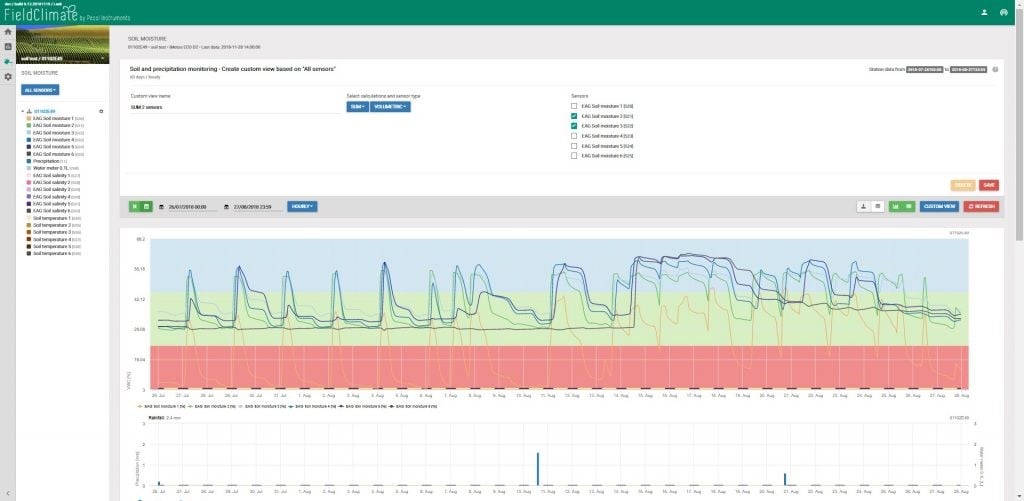
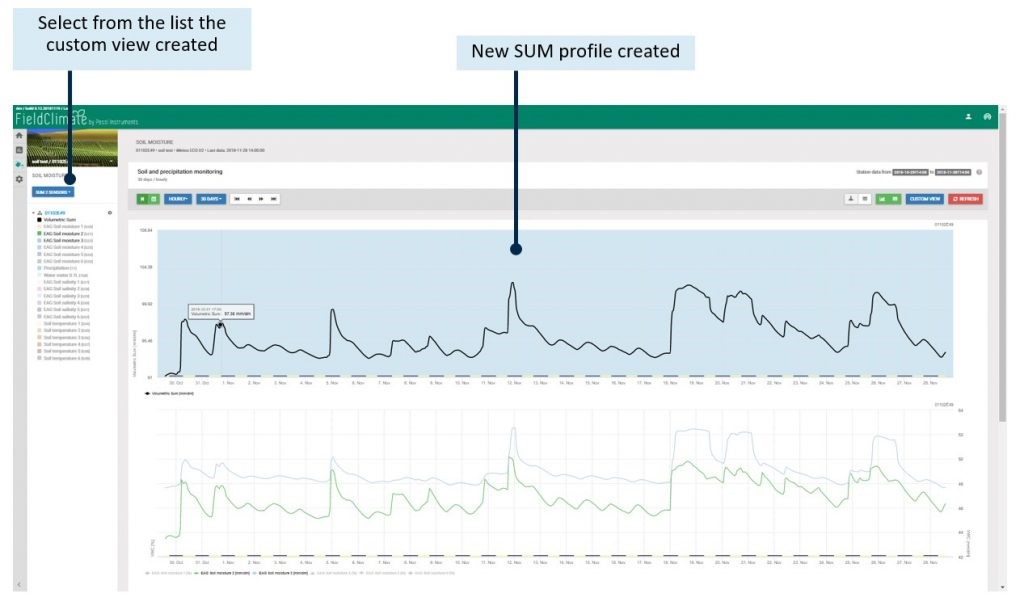 Nota: quando si calcola la SOMMA per n sensori, anche i valori del Punto di riempimento e del Punto di riempimento verranno moltiplicati per n.
8.1.3 PAW
Il calcolo della PAW (Plant Available Water) applica una normalizzazione ai dati VWC, basandosi su WP (Wilting Point) e FC (Field Capacity) che devono essere impostati nelle relative caselle per ogni serie di dati del sensore. I risultati calcolati vengono visualizzati per ogni sensore in termini di PAW, dove 100% corrispondono al Punto di Appassimento (o Capacità di Campo), mentre il valore predefinito per il Punto di Ricarica è impostato a 50%, ma può essere modificato in base alle diverse esigenze idriche delle colture. Le linee di bilancio definite dalle bande colorate (rosso, verde, blu) si riferiscono in questo caso al Punto di piena fissato a 100% e al Punto di ricarica impostato nella casella di visualizzazione personalizzata.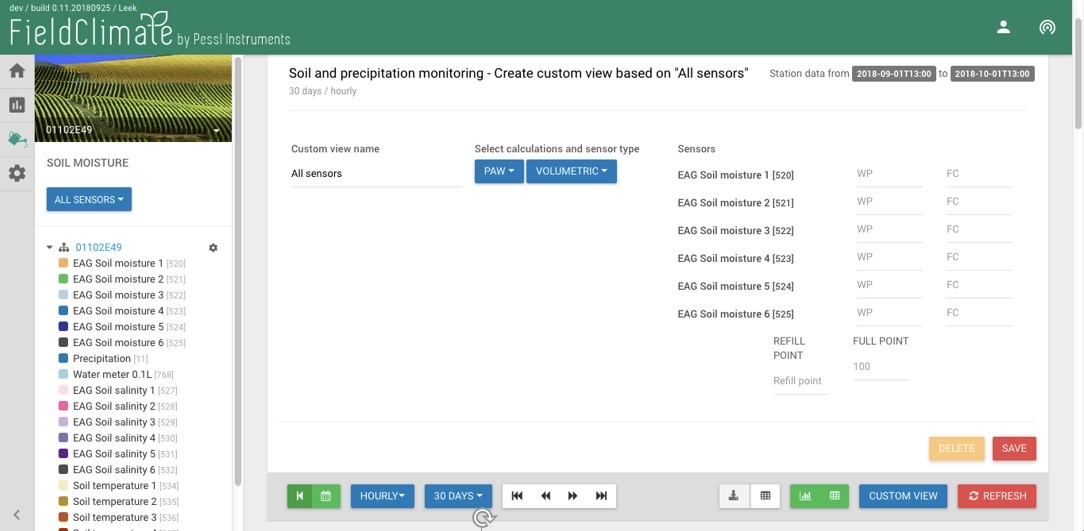
8.2 CALIBRAZIONE DELLA TESSITURA DEL SUOLO
Per alcune sonde del profilo di umidità del suolo è disponibile la colonna CALIBRAZIONE in Impostazioni -> Sensori e nodi, dove è possibile selezionare diverse equazioni di calibrazione della tessitura del suolo da applicare ai dati di umidità del suolo. Le opzioni di calibrazione della tessitura disponibili sono quelle ufficiali fornite dai produttori di sonde OEM.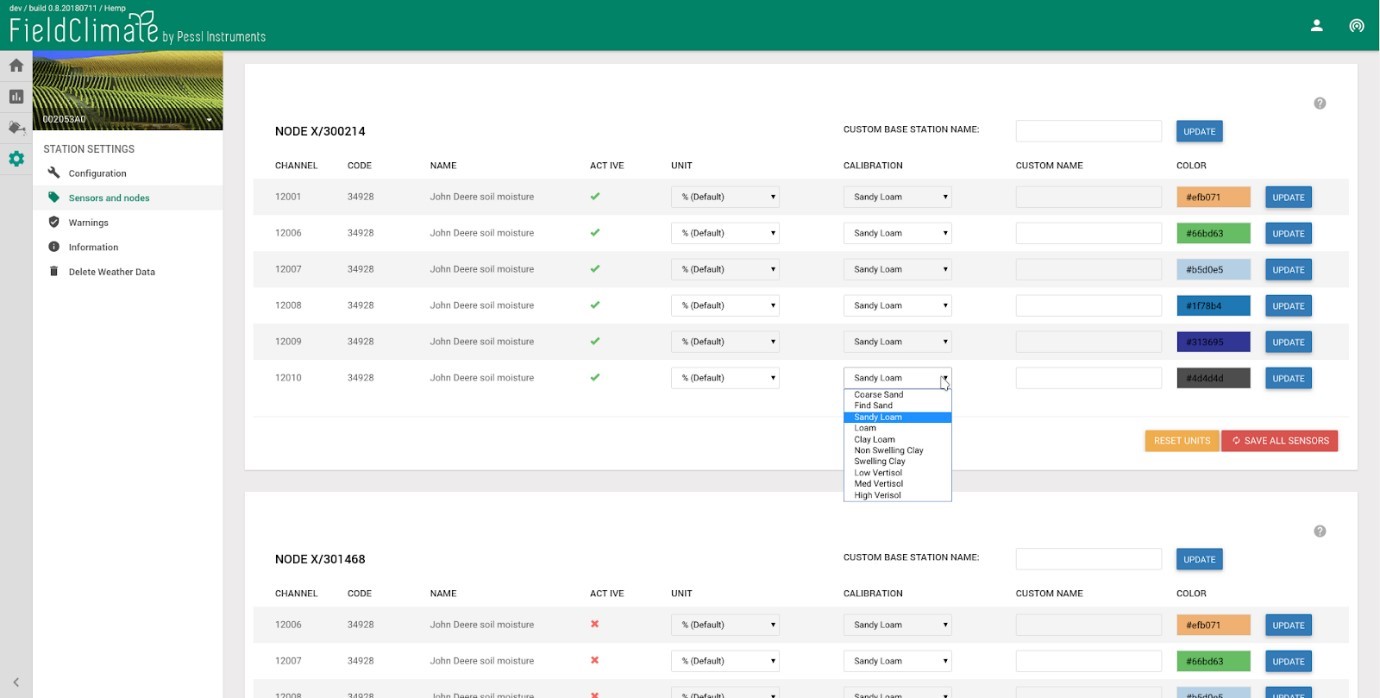 Di seguito è riportato un esempio di calibrazione della tessitura del suolo su un METOS® Sonda DDT.
 Il valore RAW proveniente dalla stazione è VWC con calibrazione Sentek Default applicata.
Le diverse equazioni di calibrazione della tessitura del suolo seguono la forma seguente:
VWC= ((SF-c)/a)^(1/b); dove VWC è il Contenuto Volumetrico d'Acqua, SF è la Frequenza Scalare e i coefficienti a,b,c dipendono dalla tessitura del suolo come indicato nella Tabella 1.
Il valore RAW proveniente dalla stazione è VWC con calibrazione Sentek Default applicata.
Le diverse equazioni di calibrazione della tessitura del suolo seguono la forma seguente:
VWC= ((SF-c)/a)^(1/b); dove VWC è il Contenuto Volumetrico d'Acqua, SF è la Frequenza Scalare e i coefficienti a,b,c dipendono dalla tessitura del suolo come indicato nella Tabella 1.
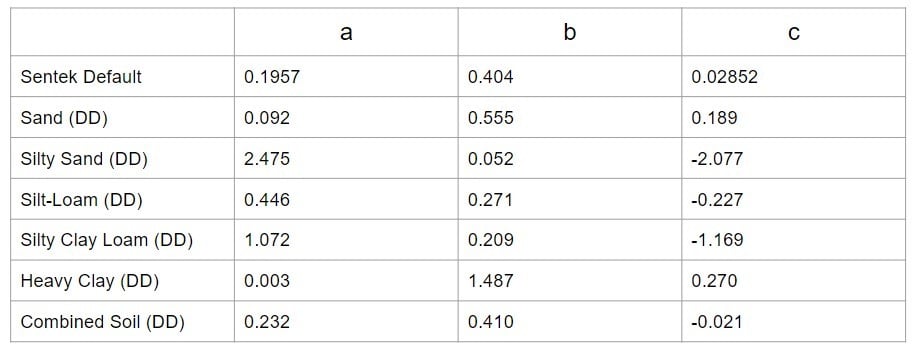 Tabella 1 - Coefficienti delle diverse equazioni di calibrazione della tessitura del suolo.
9. CropVIEW®PAGINA
Deve avere un CropVIEW® dispositivo nella vostra coltura. Si tratta di un sistema informativo agricolo che scatta periodicamente foto ad alta risoluzione della coltura. Le foto vengono caricate automaticamente sulla piattaforma FieldClimate e consentono il monitoraggio continuo delle colture e il controllo della resa. Le immagini ad alta risoluzione possono essere analizzate nel tempo in relazione ai dati ambientali. Per accedere a CropVIEW® pagina, fare clic sull'icona dell'occhio sul lato sinistro della barra. Dopo aver fatto clic sull'icona dell'occhio, si aprirà una nuova pagina con l'immagine in scala reale. Sotto l'immagine in scala reale, è possibile trovare un'opzione di selezione della data e una selezione tra le due fotocamere - grandangolo e zoom. In questo modo è possibile scegliere quale immagine mostrare in scala reale.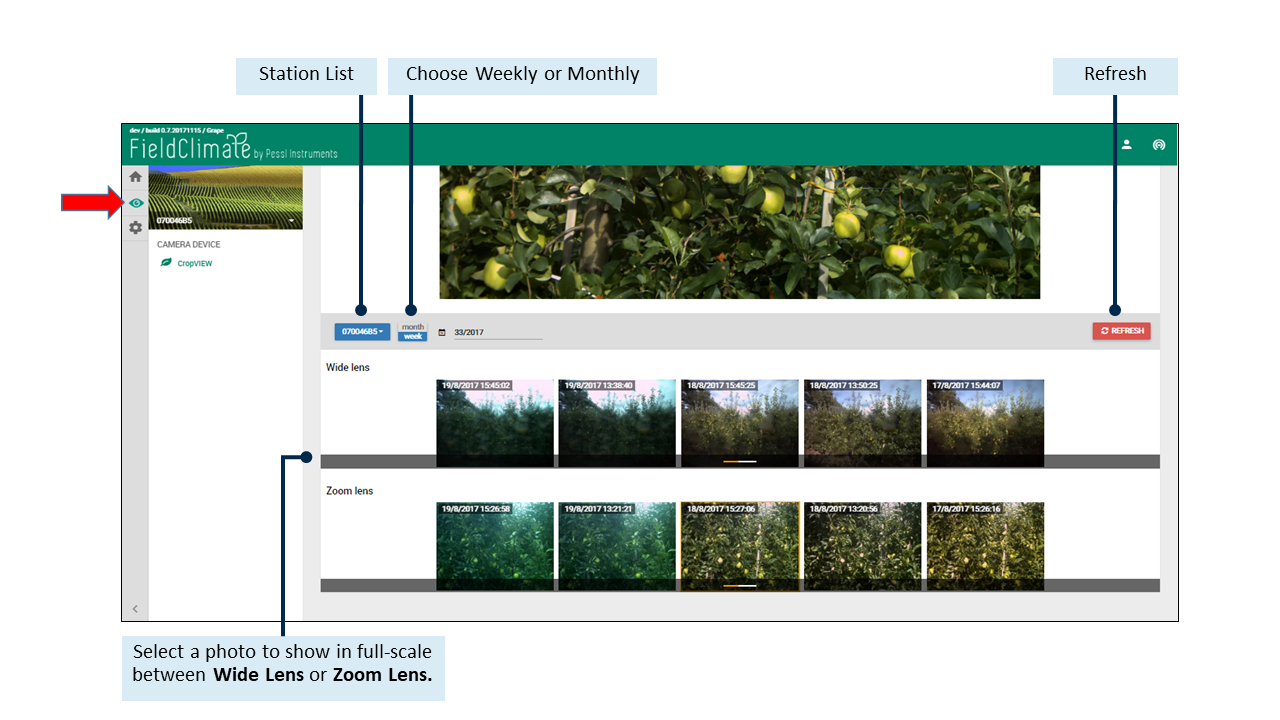
9.1 STRUMENTO PER IL DIAMETRO DEI FRUTTI
Nell'FieldClimate è stato implementato un nuovo strumento che consente di disegnare manualmente i cerchi intorno ai frutti, sulle immagini scattate dal frutteto o dal campo con CropVIEW.® dispositivo. Se si conosce con precisione la distanza tra la fotocamera e il raccolto, si otterrà anche una misura affidabile del diametro del frutto in mm (dipende dalla distanza tra la fotocamera e il raccolto - più precisa è, più precisa sarà la misura). Per iniziare a utilizzare questo strumento, è necessario selezionare un'immagine dalla fotocamera con zoom e fare clic sul pulsante "Avvia disegno" nella parte superiore dell'immagine ad alta risoluzione. Fare clic sul pulsante di aiuto (?) accanto a "Avvia disegno" e seguire le istruzioni.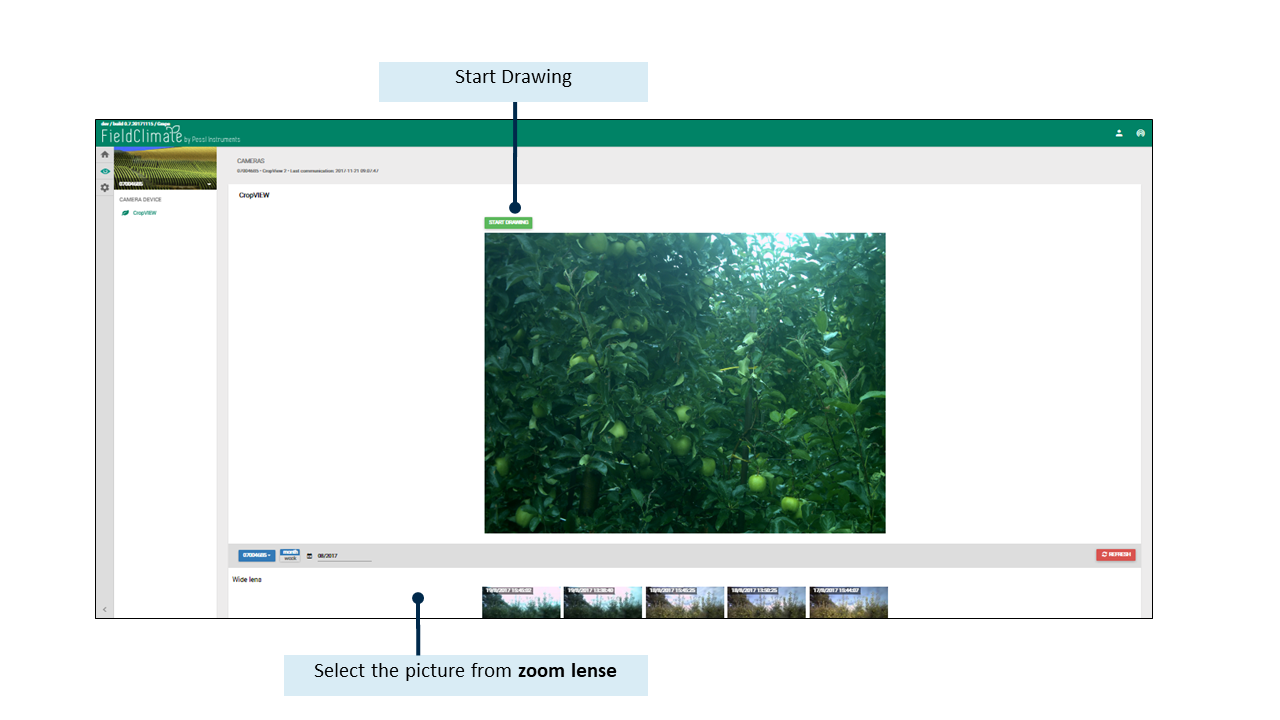 Per iniziare a disegnare sull'immagine, tenere premuto il tasto MAIUSC e il tasto sinistro del MOUSE, quindi muovere il mouse per disegnare il cerchio. Una volta rilasciato il pulsante del mouse, il cerchio verrà disegnato e fissato sull'immagine. Se si passa sopra il cerchio con il mouse, il cerchio si colora di blu. È possibile selezionare il cerchio con un clic del tasto sinistro del mouse. Una volta selezionato il cerchio, è possibile spostarlo con il mouse tenendo premuto il tasto sinistro. Per modificare il cerchio è sufficiente tenere premuto il tasto CTRL della tastiera e il tasto sinistro del mouse, quindi spostare il mouse verso sinistra se si desidera rimpicciolire il cerchio o verso destra se si desidera ingrandirlo. Per eliminare un cerchio, selezionarlo facendo clic sul cerchio che si desidera rimuovere, quindi premere il tasto CANC della tastiera. Per interrompere il disegno, fare clic sul pulsante "Interrompi disegno" in basso.
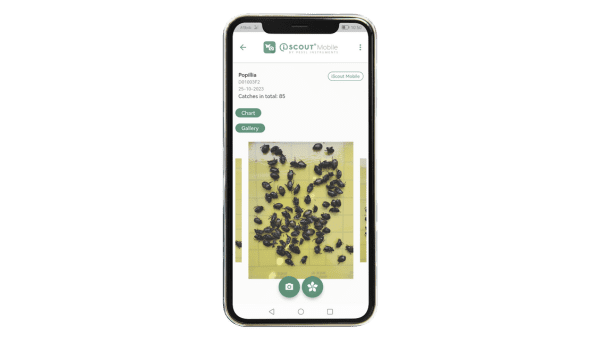
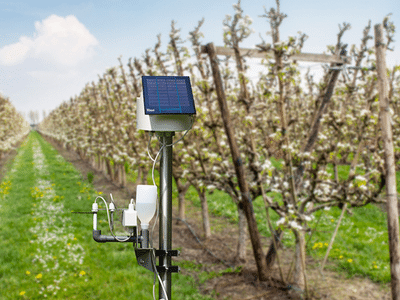
10. iSCOUT® PAGINA
iSCOUT®è una combinazione di hardware e software con l'obiettivo di monitorare a distanza gli insetti nocivi dell'agricoltura. Grazie all'elettronica integrata e alla piastra adesiva, è abbastanza intelligente da poter essere appeso dove necessario. Sul campo, il dispositivo è autosufficiente, essendo alimentato da un pannello solare e da una batteria. La fotocamera integrata scatta immagini ad alta risoluzione della piastra adesiva all'interno dell'iSCOUT. Le immagini vengono inviate via LTE/UMTS alla piattaforma FieldClimate dove vengono analizzate con metodi ML. I risultati sono poi visibili sul web e sui dispositivi mobili. Questi dati in tempo reale possono essere utilizzati per ulteriori analisi e per supportare tempestivamente le vostre decisioni.® La pagina FieldClimate è accessibile facendo clic sull'icona dell'occhio sul lato sinistro della barra. Dopo aver fatto clic sull'icona dell'occhio, si aprirà una nuova pagina con le immagini del dispositivo. Nella Galleria vengono mostrate tutte le immagini per mese, settimana, stagione (è possibile utilizzare l'elenco a discesa per cambiare). Importante: fare clic su Aggiorna dopo aver scelto un'opzione. Se si desidera vedere i mesi/settimane/stagioni precedenti, utilizzare i pulsanti per andare indietro o avanti.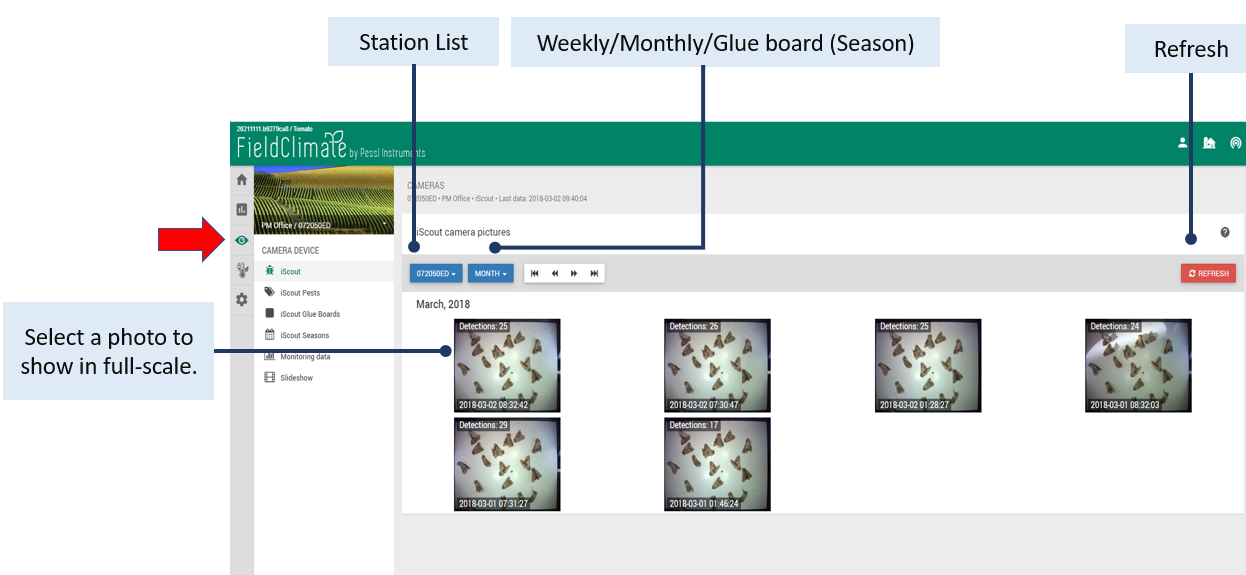
10.1 STRUMENTO DI RILEVAMENTO DEGLI INSETTI
Facendo clic su un'immagine viene visualizzata la "modalità di correzione" con il rilevamento automatico degli insetti, disegnati come rettangoli verdi intorno all'insetto. I rettangoli più spessi indicano i nuovi insetti rilevati dal sistema in base all'immagine precedente. È possibile rinominare i rettangoli disegnati sull'immagine. Selezionare il rettangolo, fare clic con il pulsante destro del mouse ed etichettare/marcare l'insetto in base all'elenco predefinito di insetti nocivi o creare un proprio elenco di insetti nocivi. I rilevamenti vengono tracciati avanti e indietro, quindi esistono finché l'insetto rimane in quella posizione. È anche possibile disegnare manualmente dei rettangoli e assegnare loro un nome, ma rimarranno solo nella foto in cui è stato fatto il disegno. Ricordarsi di SALVARE le modifiche. Se si desidera nascondere gli insetti che non interessano, è possibile farlo facendo clic sul loro nome nell'angolo in alto a destra: i risultati del rilevamento diventano inattivi (grigi). È anche possibile esportare l'immagine.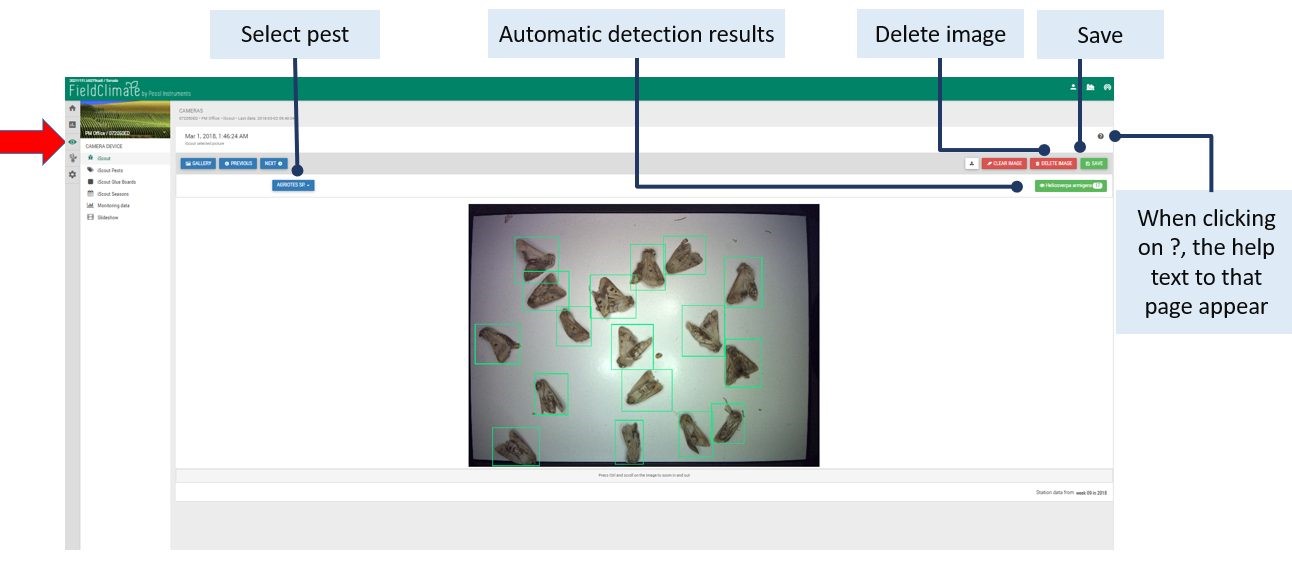
10.2 iSCOUT® PESTE
Per impostazione predefinita, è disponibile un elenco di vari insetti nocivi per l'agricoltura. Tuttavia, è possibile disattivare la visibilità di questo elenco di parassiti (fare clic su NO alla domanda "Visualizzare i parassiti definiti dal sistema?") e creare un proprio elenco di parassiti con ADD PEST.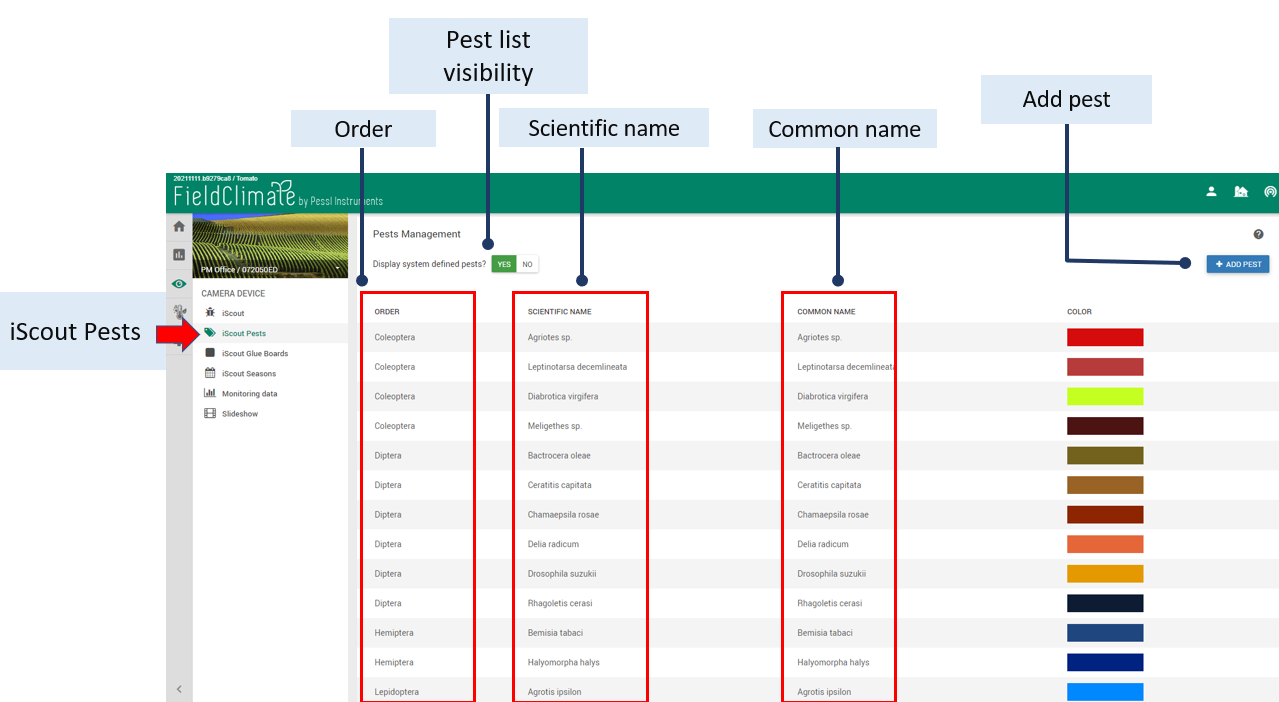
10.2.1 AGGIUNGERE UN NUOVO PARASSITA
Qui è obbligatorio scegliere l'ordine dell'insetto nocivo, mentre in tutti gli altri campi è possibile scegliere liberamente i nomi. Il nuovo insetto aggiunto apparirà nell'elenco degli insetti nocivi e nel modello di correzione da selezionare per l'etichettatura sulla foto. Ricordarsi di SALVARE le modifiche.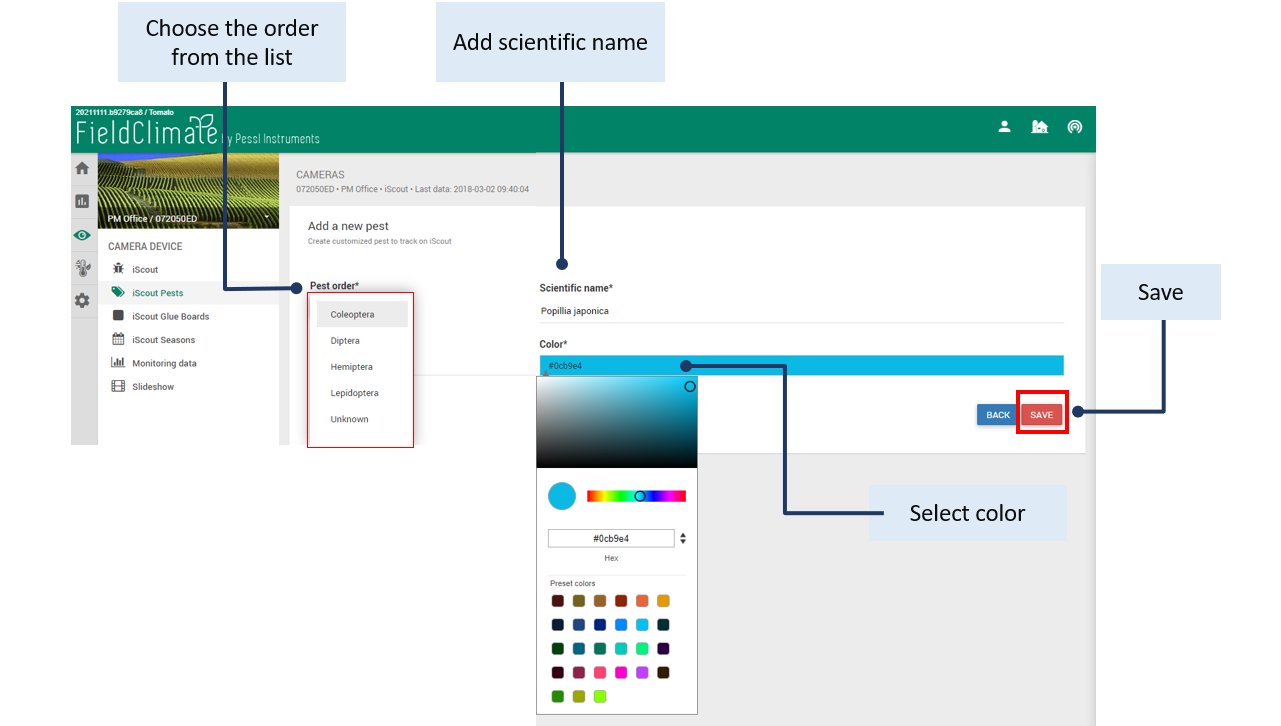
10.3 iSCOUT® BARRE DI COLLA
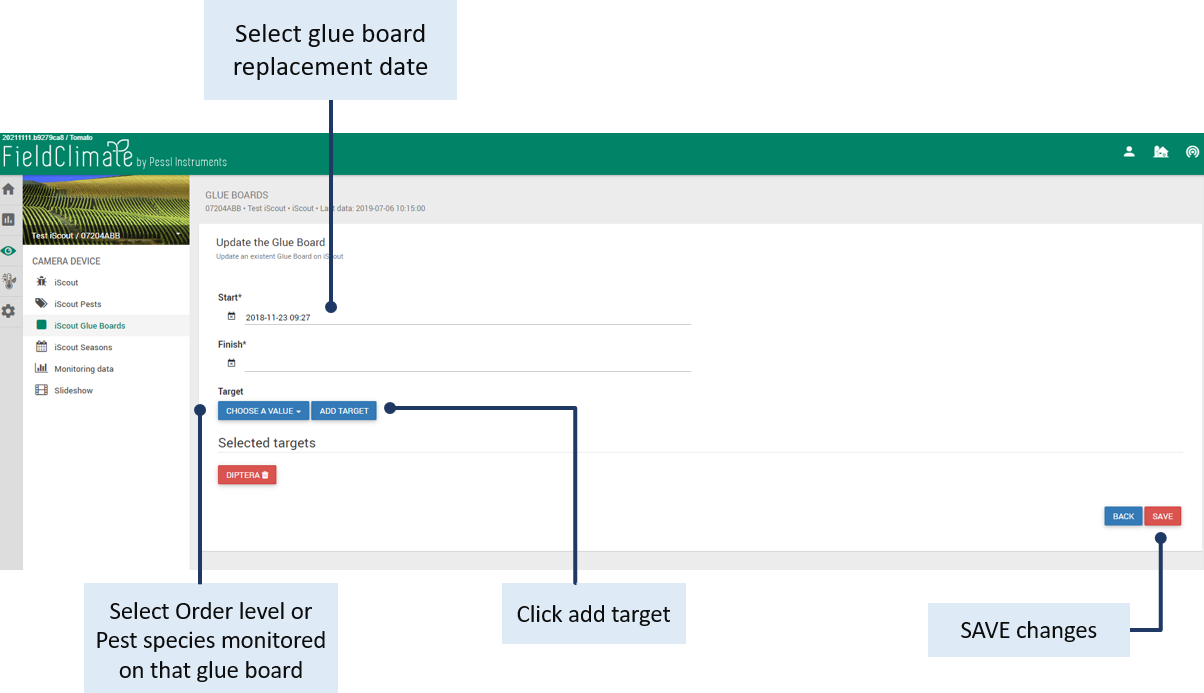
iSCOUT® I pannelli collanti vi aiutano a gestire la vostra stagione di monitoraggio dei parassiti.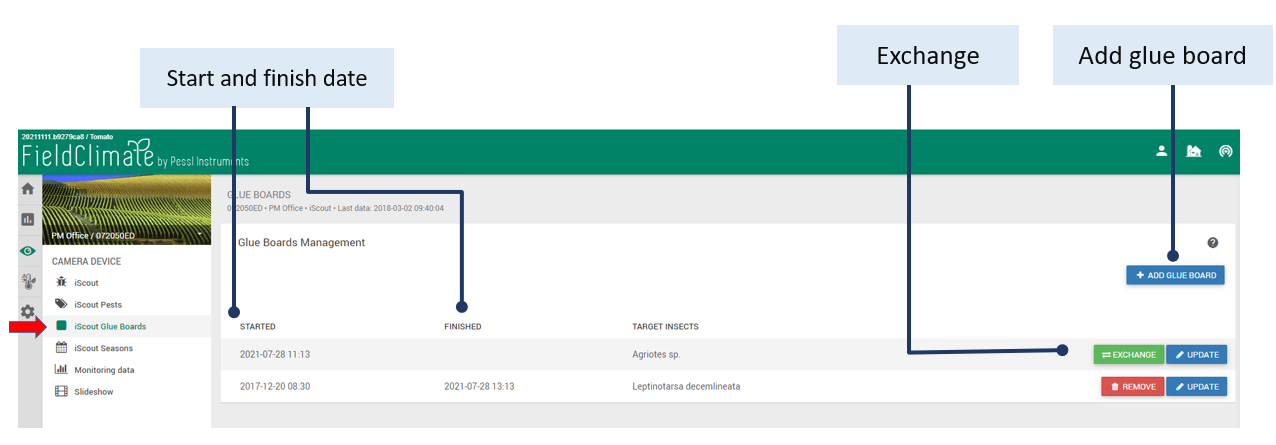 L'opzione "ADD GLUE BOARD" consente di definire quando il pannello collante è stato sostituito e quando è stato sostituito con uno nuovo. È inoltre possibile definire l'elenco degli insetti nocivi (a livello di ordine o di specie) monitorati su quella tavola collante facendo clic su "AGGIUNGI BERSAGLIO". L'uso di questa funzione e l'aggiunta di insetti target specifici nella pagina del pannello collante influenzerà la pagina di rilevamento con le foto; solo gli insetti aggiunti come target e di interesse saranno visti e seguiti nelle foto. Tutti gli altri vengono gestiti come "insetti non interessati" e vengono nascosti automaticamente.
Assicurarsi di fare clic sul pulsante "SALVA" dopo aver apportato qualsiasi modifica, altrimenti le modifiche andranno perse.
L'opzione "ADD GLUE BOARD" consente di definire quando il pannello collante è stato sostituito e quando è stato sostituito con uno nuovo. È inoltre possibile definire l'elenco degli insetti nocivi (a livello di ordine o di specie) monitorati su quella tavola collante facendo clic su "AGGIUNGI BERSAGLIO". L'uso di questa funzione e l'aggiunta di insetti target specifici nella pagina del pannello collante influenzerà la pagina di rilevamento con le foto; solo gli insetti aggiunti come target e di interesse saranno visti e seguiti nelle foto. Tutti gli altri vengono gestiti come "insetti non interessati" e vengono nascosti automaticamente.
Assicurarsi di fare clic sul pulsante "SALVA" dopo aver apportato qualsiasi modifica, altrimenti le modifiche andranno perse.
10.4 Gestione delle stagioni iSCOUT
Le tavole di colla sono riassunte in stagioni. Fare clic su "AGGIUNGI STAGIONE" per organizzare le foto per stagione. Assicurarsi di fare clic sul pulsante "SALVA" dopo aver apportato le modifiche, altrimenti queste andranno perse. Il pulsante "BACHECA" consente di visualizzare le informazioni sulla scheda (data, numero di insetti). È anche possibile rimuovere o aggiornare le informazioni sulle stagioni.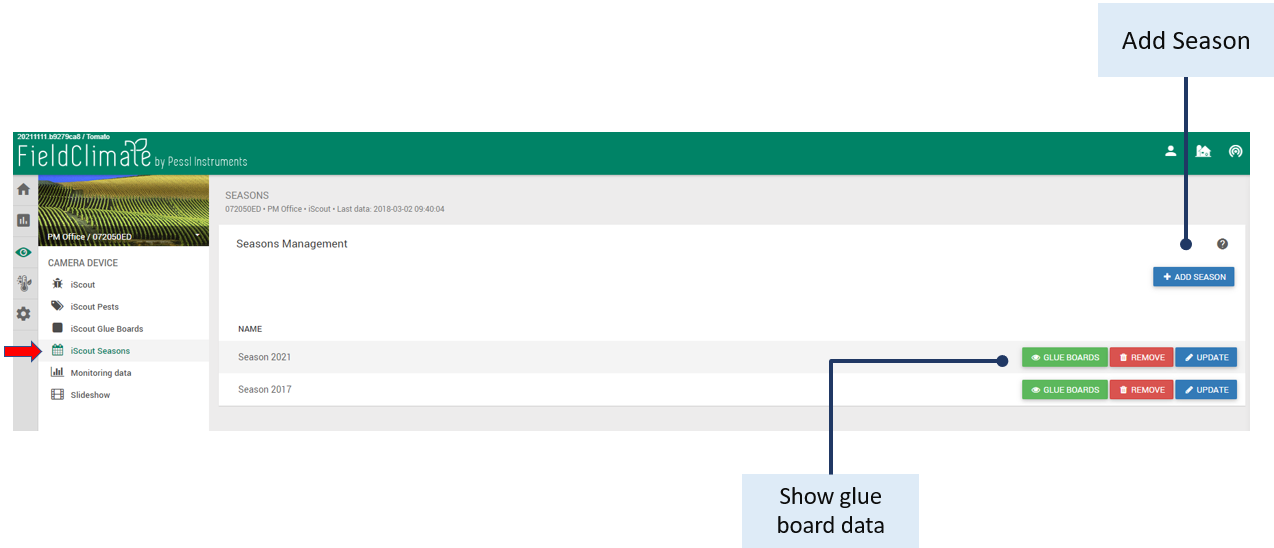
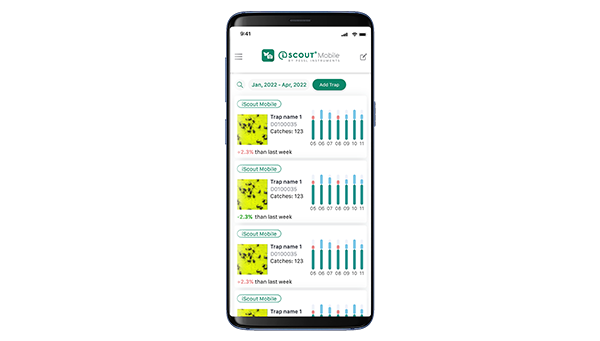
10.5 DATI DI MONITORAGGIO
In questa pagina si trovano i rilevamenti/contamenti di insetti visualizzati sotto forma di grafico e tabella. Fare clic sul pulsante "Modalità di selezione data/settimana" per inserire il periodo di tempo utilizzando il calendario per mostrare i dati. È possibile visualizzare i dati di uno specifico periodo di tempo selezionato (da-a) o di un collegio o di una stagione. Quando si sceglie il quadro di riferimento/stagione, vengono mostrati solo gli obiettivi (definiti nei quadri di riferimento) e vengono visualizzati anche nella pagina di monitoraggio. Esiste la possibilità di esportare i grafici come immagine e le tabelle come "xls". Facendo clic su Toggle Charts o Toggle Table è possibile nascondere i grafici e le tabelle. Assicurarsi di fare clic sul pulsante "Aggiorna" dopo aver apportato qualsiasi modifica.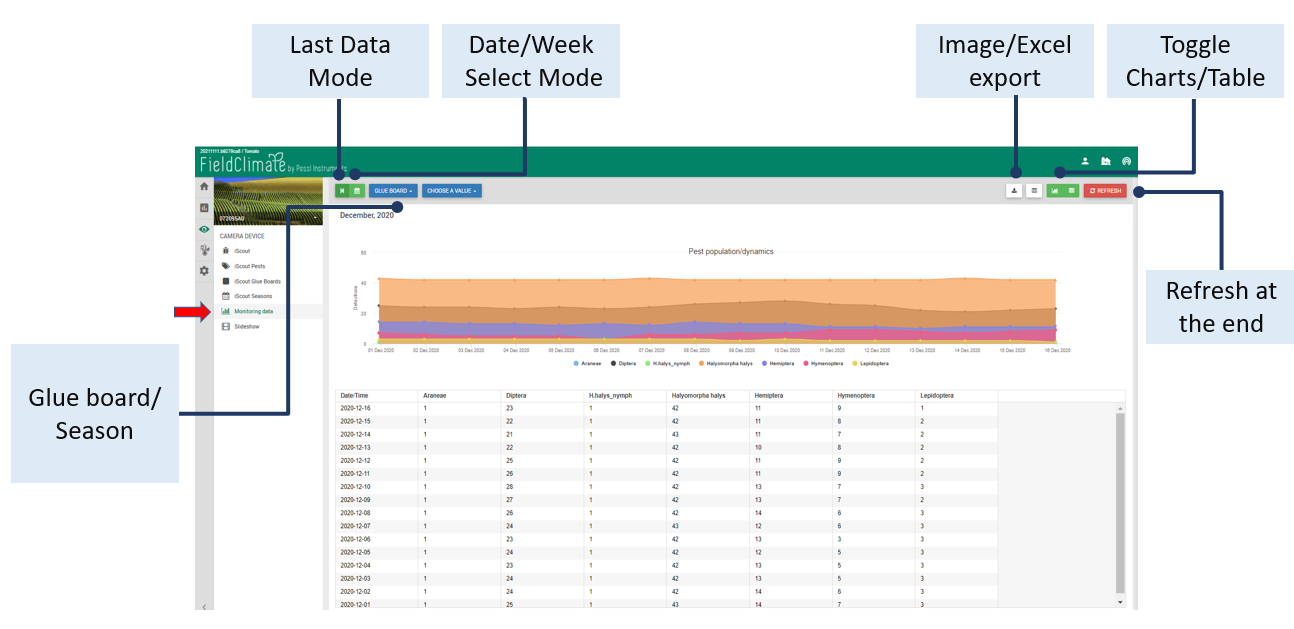
10.6 PRESENTAZIONE DELLA FOTOCAMERA
La presentazione della fotocamera consente di visualizzare le foto come una presentazione. Fare clic sul pulsante "Modalità selezione data/settimana" per inserire il periodo di tempo utilizzando il calendario per mostrare i dati. È inoltre possibile impostare la velocità di riproduzione della presentazione, il riavvolgimento o selezionare lo schermo intero. Assicurarsi di fare clic sul pulsante "Aggiorna" dopo aver apportato qualsiasi modifica.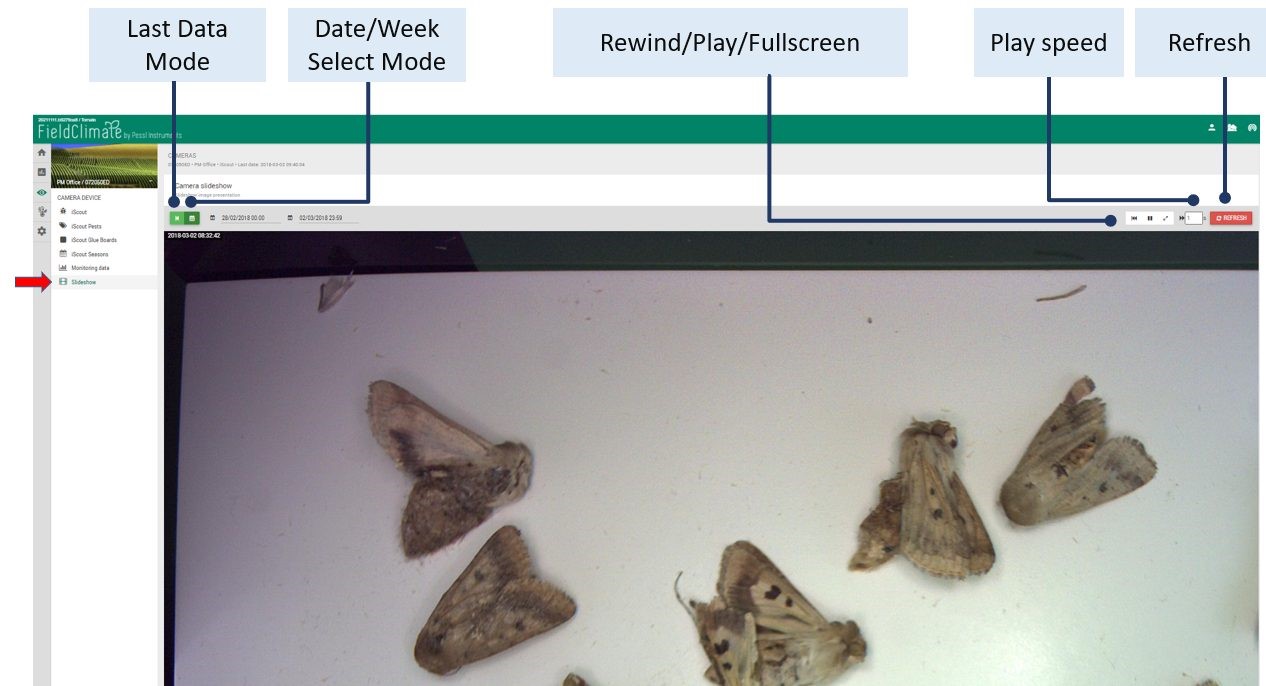
11. PAGINA DELLE IMPOSTAZIONI DELLA STAZIONE
11.1 CONFIGURAZIONE
11.1.1 IMPOSTAZIONI DEL FUSO ORARIO E DELLA LOCALITÀ
Alla voce fuso orario e località è necessario fornire informazioni precise, poiché le previsioni del tempo e altri servizi dipendono da queste. Si tenga presente che l'impostazione precisa della posizione e del fuso orario è essenziale per il corretto funzionamento delle previsioni del tempo e di altri servizi. Se il dispositivo dispone di un GPS integrato, la posizione e il fuso orario verranno acquisiti automaticamente. Altrimenti, è possibile definire la posizione manualmente in diversi modi: Trascinare l'indicatore sulla mappa fino alla propria posizione. Inserire la posizione (tramite indirizzo) nella casella "Ricerca posizione" e poi fare clic sul pulsante "VAI! Inserire le coordinate della posizione del dispositivo nelle caselle "Longitudine, Latitudine, Altitudine" (è possibile acquisire le coordinate con l'aiuto del telefono cellulare, se dotato di GPS integrato). Il fuso orario viene impostato automaticamente se si trascina il marker sulla mappa o se si trova la posizione dall'input "Ricerca posizione". Per inserire manualmente il fuso orario: Selezionare il fuso orario corretto da un elenco. Al termine della configurazione, non dimenticate di salvare le nuove impostazioni (fate clic sul pulsante "Salva posizione").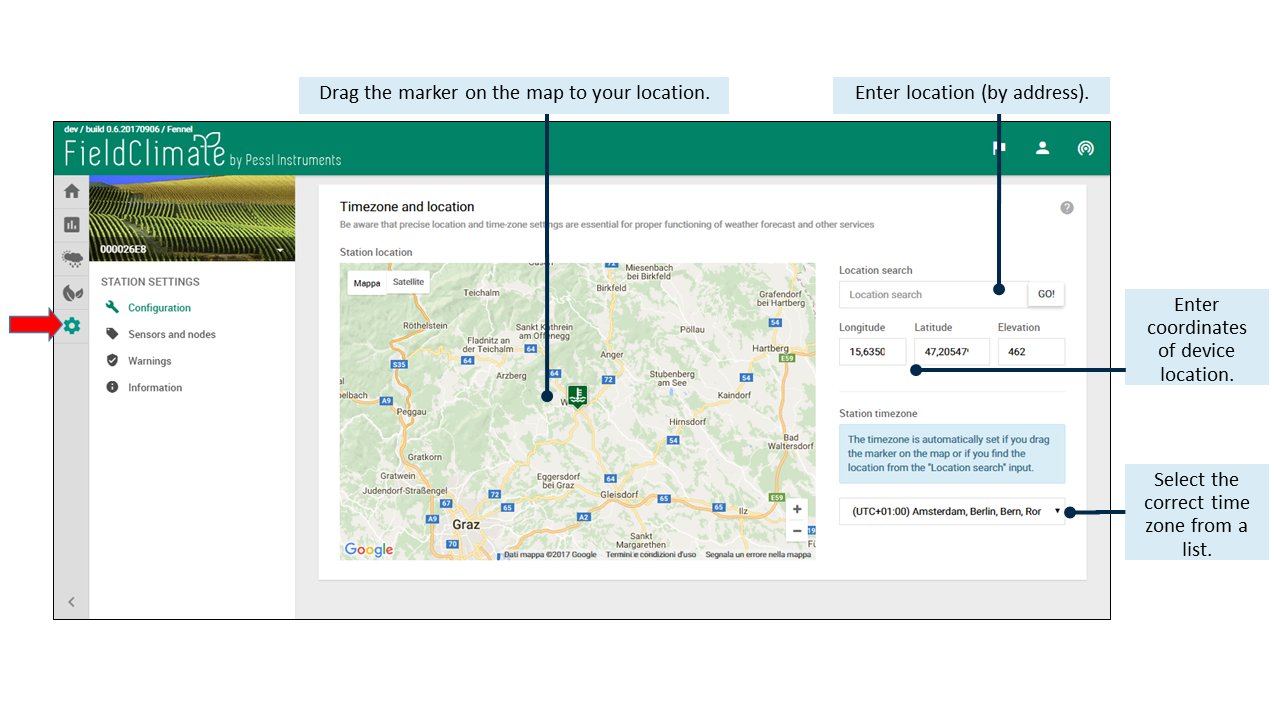
11.1.2 IMPOSTAZIONI DI REGISTRAZIONE E TRASFERIMENTO
In Impostazioni di trasferimento è possibile definire il modo in cui l'METOS® Il dispositivo sta inviando dati. L'impostazione dell'intervallo di registrazione e dei tempi di trasmissione funziona con i valori predefiniti, purché non vengano modificati. Per impostazione predefinita, l'intervallo di registrazione è di 60 minuti. Una riduzione dell'intervallo di registrazione aumenta il consumo di energia e il costo di trasferimento dei dati. Può essere impostato su 10, 15, 20, 30, 60 e 120 minuti. Per intervallo di registrazione si intende l'intervallo di tempo in cui la stazione legge i dati da tutti i sensori e li memorizza. Con Scheduler è possibile selezionare le ore del giorno (è possibile solo l'orario completo) in cui i dati memorizzati saranno trasferiti al server. È necessario selezionare almeno una trasmissione al giorno. L'utilizzo di un numero minore di tempi di trasferimento diminuisce il costo di trasferimento dei dati.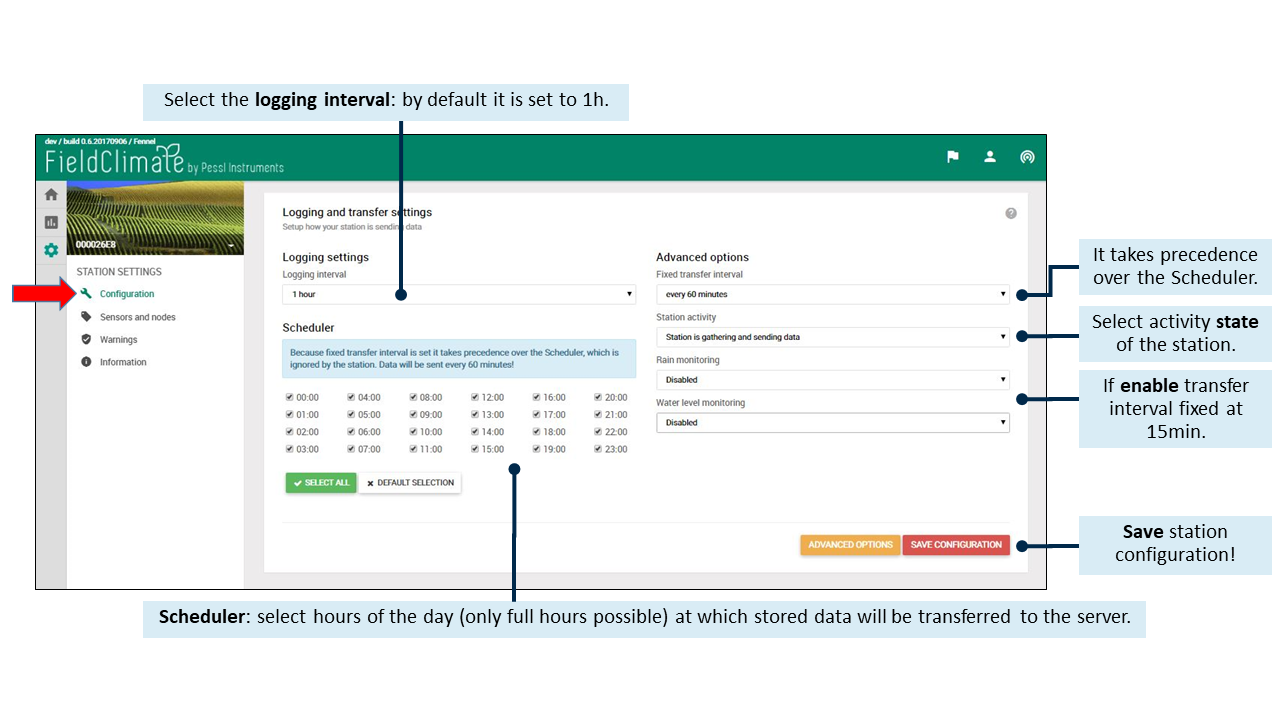 È possibile impostare anche un intervallo di trasferimento fisso definito dall'utente. Fare clic sul pulsante "Opzioni avanzate" e apparirà un nuovo menu con le opzioni successive:
- Fissando l'intervallo di trasferimento ogni 60 minuti, ha la precedenza sullo Scheduler, che viene ignorato dalla stazione: i dati possono essere inviati ogni 10, 15, 20, 30 o 60 minuti. È anche possibile disattivare l'opzione di intervallo di trasferimento fisso, dando la precedenza allo Scheduler.
- Attività della stazione: Qui si può selezionare lo stato di attività della stazione. È possibile disattivarla completamente, scegliendo Station is switched off nel menu a discesa, oppure selezionando Station is gathering but not sending data (la stazione sta raccogliendo ma non inviando dati), si metterà la stazione in una modalità in cui sta solo registrando ma non trasmettendo. Per impostazione predefinita, la stazione è impostata sulla modalità di lavoro normale e raccoglie e invia dati.
- Se è abilitato il monitoraggio della pioggia, l'METOS® Il dispositivo misura, registra e trasferisce i dati a un intervallo fisso di 15 minuti durante la pioggia. Per impostazione predefinita, il monitoraggio della pioggia è disattivato. Questa opzione è disponibile solo per le stazioni dotate di sensore pluviometrico.
- Se il monitoraggio del livello dell'acqua è abilitato, l'METOS® Il dispositivo invia i dati al server ogni 15 minuti durante gli eventi di allagamento. L'utente può definire una soglia di livello dell'acqua. Quando la soglia viene superata, il dispositivo METOS® Il dispositivo misura, registra e trasferisce i dati nell'intervallo specificato. Questa opzione è disponibile solo per le stazioni dotate di sensore di livello dell'acqua.
11.1.3 CropVIEW® e iSCOUT® PAGINA DI CONFIGURAZIONE
Impostare il fuso orario e la località: queste impostazioni sono molto importanti perché sono essenziali per il corretto funzionamento di alcuni servizi. Per impostare il fuso orario e la posizione CropVIEW® Le impostazioni seguono le stesse impostazioni per un METOS® dispositivo. Configurare le impostazioni di trasferimento: configurare il modo in cui il dispositivo CropVIEW® è l'invio di dati. Tenete presente che lo scatto e l'invio di immagini consumano molti dati e molta energia. Per questo motivo, abbiamo impostato la limitazione di scattare foto tre volte al giorno. Impostare la fotocamera: configurare le impostazioni della fotocamera. Tenere presente che le impostazioni sbagliate possono causare immagini danneggiate. Modificare queste impostazioni solo se si è sicuri di sapere cosa si sta facendo. Per iSCOUT® è possibile impostare la modalità di invio dei dati da parte della stazione. Per mantenere la quantità di dati sotto 1GB e all'interno del vostro piano mensile, il numero massimo di immagini catturate è limitato a tre al giorno. In caso di basse temperature, assicuratevi che la vostra stazione trasmetta solo una volta al giorno per risparmiare la batteria. È inoltre possibile personalizzare le impostazioni della fotocamera, ma si consiglia di mantenere le impostazioni predefinite.11.2 SENSORI E NODI
In questa sezione è possibile definire un nome personalizzato per la stazione e per tutti i nodi ad essa collegati. Ogni METOS® Il dispositivo viene significativamente denominato con un numero di serie. Per la maggior parte degli utenti è più comodo assegnargli un nome dopo l'installazione del sito. Inoltre, è possibile definire un nome e un colore personalizzati per ogni singolo sensore collegato alla stazione. Per ogni singolo sensore si può anche selezionare l'unità di misura in cui il valore del sensore sarà presentato nei grafici e nelle tabelle. Dopo aver definito unità, nomi e colori personalizzati, è necessario salvare le impostazioni. È possibile farlo facendo clic sul pulsante "aggiorna" per ogni singolo sensore o sul pulsante "salva tutto" alla fine dell'elenco dei sensori, per salvare tutto in una volta. Il pulsante "Reimposta sensori" consente di ripristinare i valori predefiniti di tutte le unità dei sensori. (Nota importante: quando si modificano le impostazioni dell'unità (metrica/imperiale) nel menu Utente, la modifica riguarda solo le impostazioni predefinite dell'unità del sensore e non quelle personalizzate).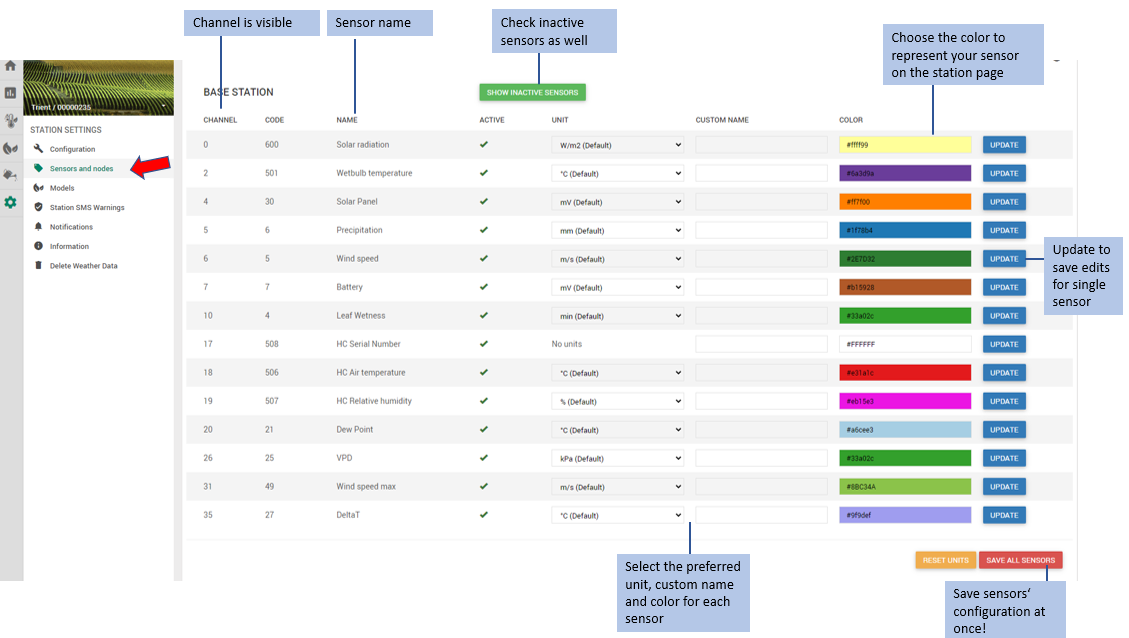
11.3 AVVISI SMS
11.3.1 NUMERI DI TELEFONO
In questa sezione è possibile definire i numeri di telefono e i nomi ad essi associati, ai quali si desidera che venga inviato un SMS di avviso. In Aggiungi numero di telefono è possibile inserire il numero di telefono insieme al prefisso internazionale e al nome personalizzato ad esso associato. Dopo aver riempito le caselle di input, fare clic sul pulsante "AGGIUNGI" per aggiungere il numero di telefono. Se si desidera che un SMS di avviso venga inviato a più numeri, è possibile aggiungere altri numeri di telefono all'elenco. In Elenco dei numeri di telefono vengono visualizzati tutti i numeri di telefono e i nomi associati che sono stati aggiunti. Se si desidera, è anche possibile impostare lo stato di un numero di telefono da attivo (per impostazione predefinita) a non attivo (facendo clic sul pulsante "sì/no"). In questo modo è possibile scegliere quali numeri di telefono dall'elenco verranno inviati gli SMS di avviso. Facendo clic sul pulsante "rimuovi" è anche possibile rimuovere un determinato numero di telefono dall'elenco. Al termine della configurazione, non dimenticate di salvare le nuove impostazioni effettuate (cliccando sul pulsante "salva numeri di telefono").
11.3.2 IMPOSTAZIONE AVVISO SMS
L'utente può definire una soglia superiore e inferiore di valori di allarme SMS per ciascun sensore. Se un valore misurato supera (o scende al di sotto) della soglia stabilita, l'METOS® Il dispositivo invierà un SMS con un testo di avviso (nome del sensore, valore effettivo, valore di soglia) a un massimo di 30 numeri di cellulare diversi. Le soglie di allarme vengono controllate ogni 5 minuti per ogni misurazione. Quando l'METOS® riceve la conferma di invio dalla rete mobile l'METOS® il dispositivo disabilita l'invio di SMS per 4 ore. Ma se un valore misurato scende al di sotto della soglia in 3 cicli di misura successivi, l'METOS® abilita nuovamente l'invio di SMS e invia l'allarme corrispondente.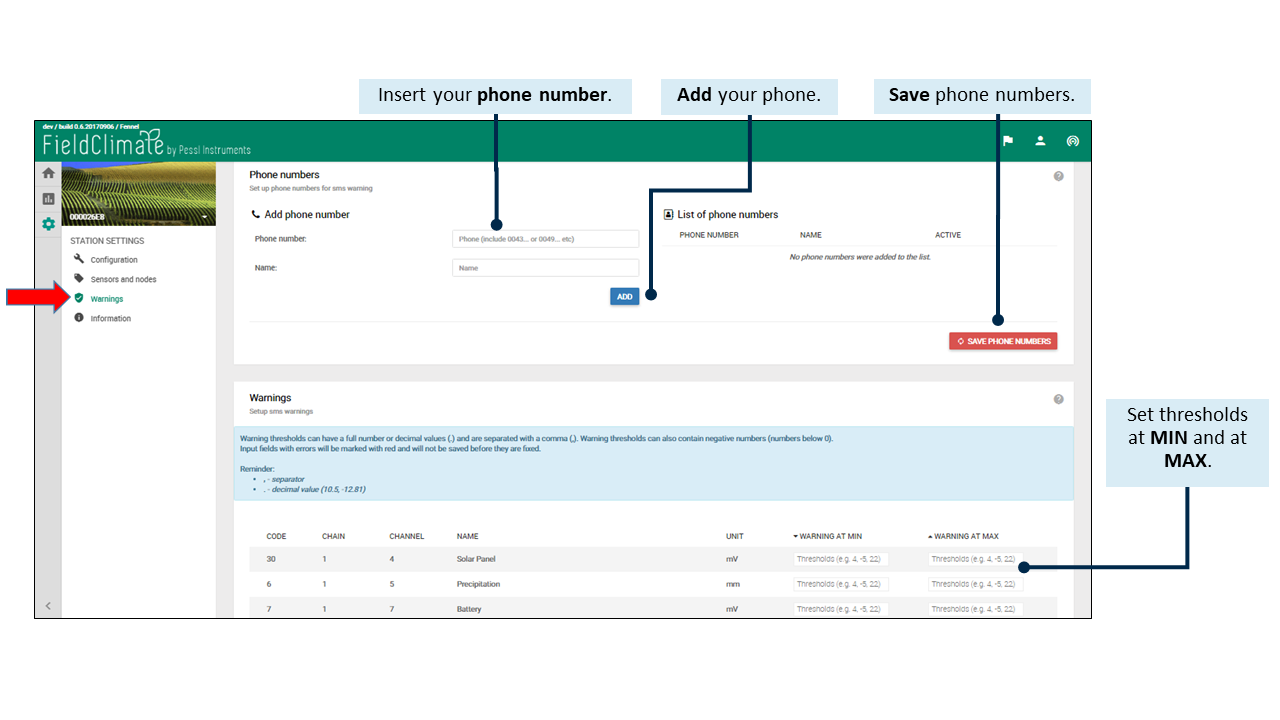
11.4 NOTIFICHE
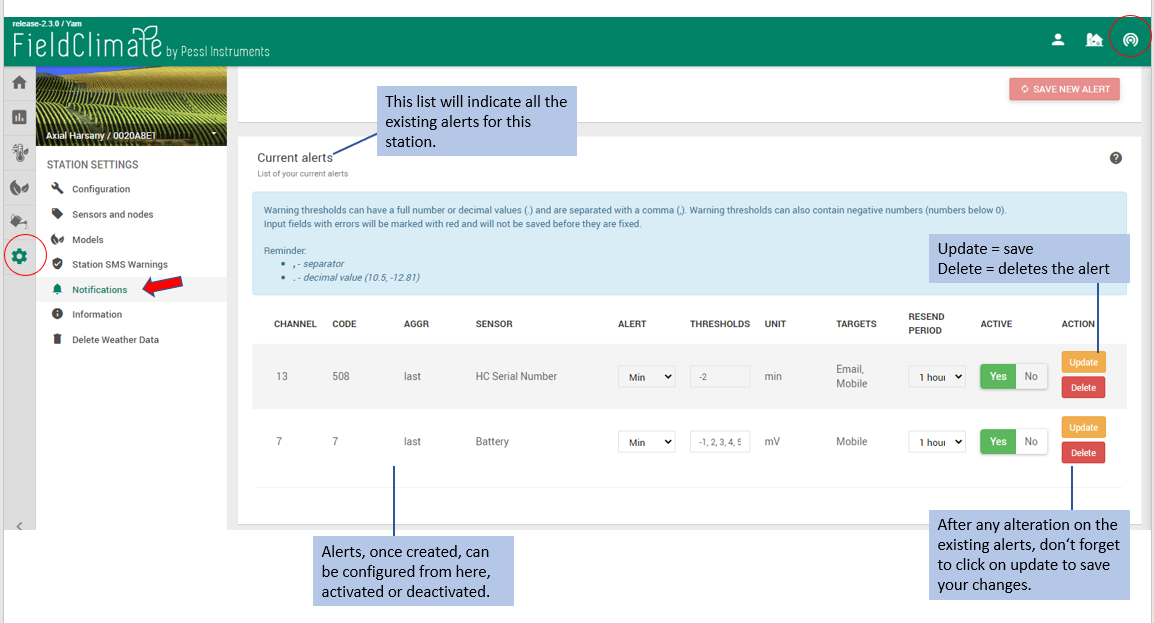
11.4.1 CREARE NUOVI AVVISI
Nella pagina delle notifiche è possibile creare nuovi avvisi, controllare e modificare quelli esistenti. La prima parte della schermata consiste nella creazione di nuove notifiche in base al livello della stazione. Per una particolare stazione, gli utenti possono indicare se: l'avviso è al massimo o al minimo, scegliere il tipo di sensore, impostare una o più soglie, impostare l'ora di reinvio e aggiungere facoltativamente un indirizzo e-mail. Gli avvisi seguiranno quindi queste impostazioni, inviati via e-mail o via SMS, nel caso in cui sia stato aggiunto un numero di cellulare nella sezione Avvisi via SMS.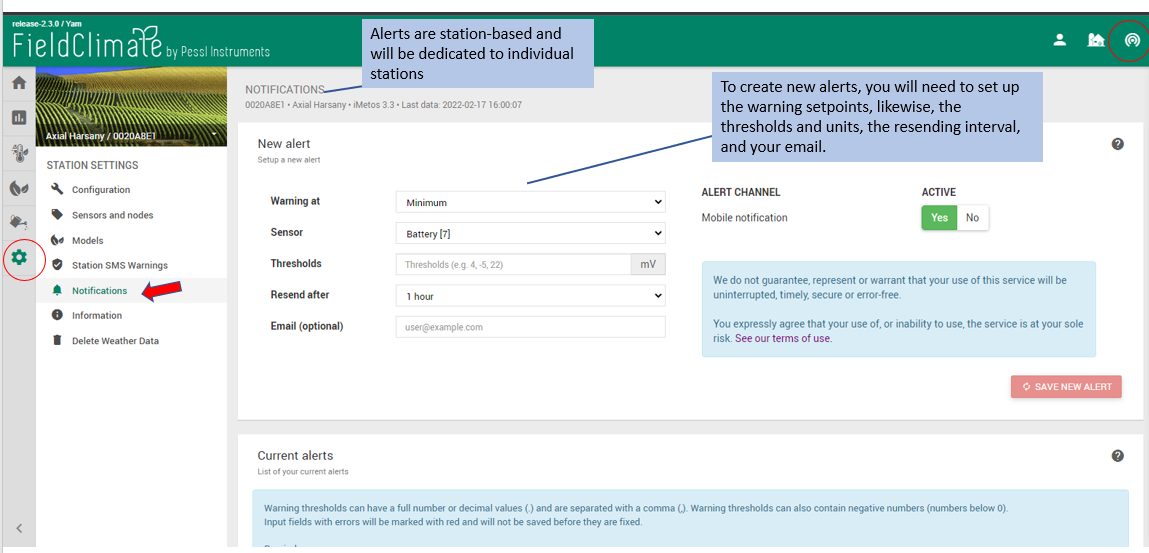 Tutte le notifiche create per questa stazione saranno visibili nella sezione "Avvisi correnti". In questa sezione della pagina, gli utenti possono configurare, attivare o disattivare una notifica corrente. Per salvare le nuove modifiche, non dimenticate di cliccare su "Aggiorna".
11.5 INFORMAZIONI
Questa pagina contiene solo informazioni relative a Informazioni di base, Dettagli rete, Dati meteo e Posizione GPS e non ci sono opzioni di configurazione. Il nome definito dall'utente non viene visualizzato come definito nei sensori e nei nodi, ma viene visualizzato sempre "/". Facendo clic su "Eventi della stazione" o "Cronologia delle comunicazioni" è possibile visualizzare ulteriori informazioni.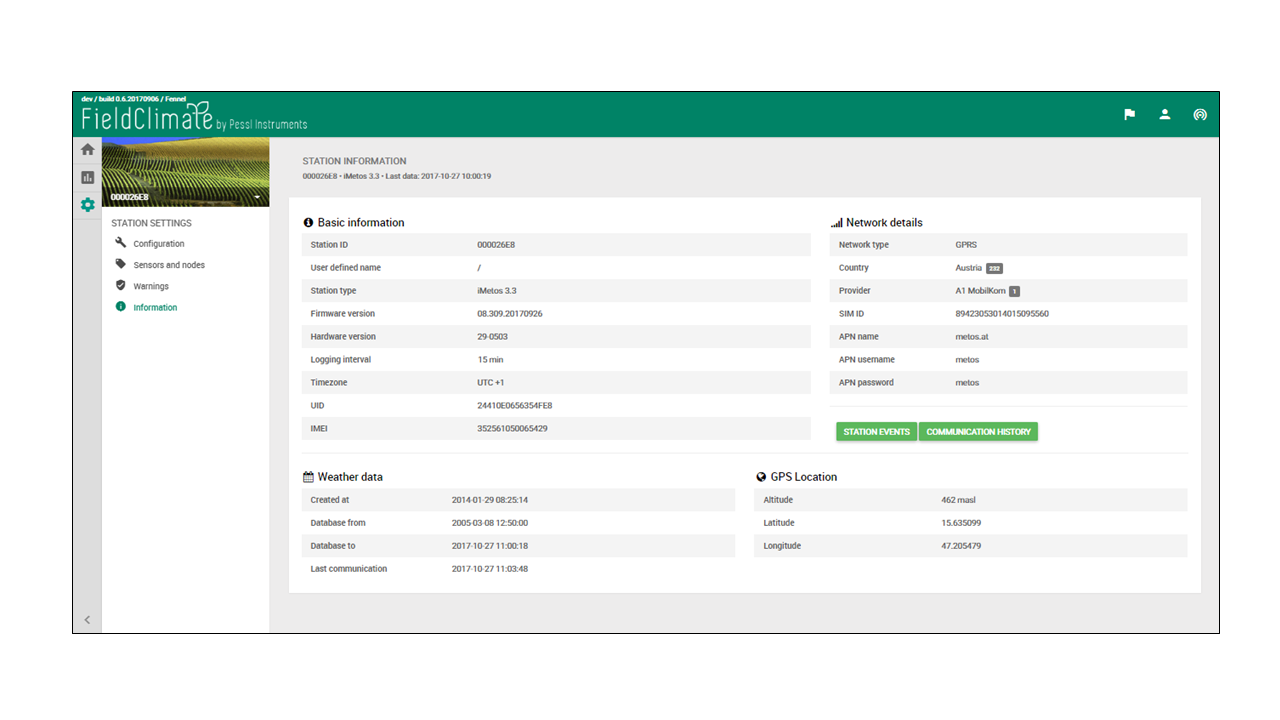
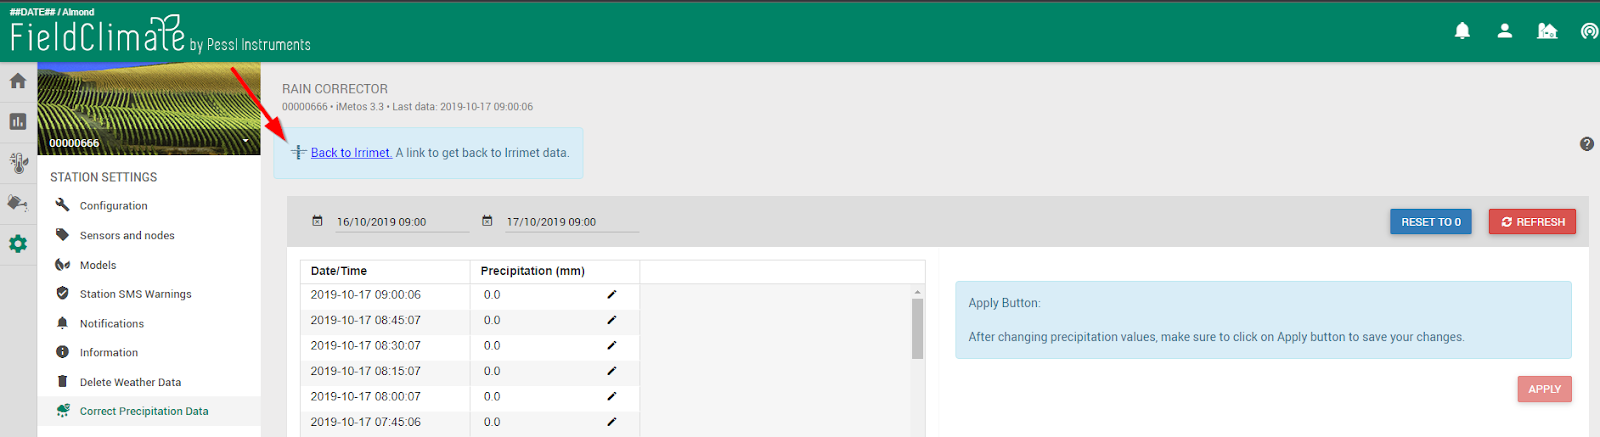
11.6 DATI CORRETTI SULLE PRECIPITAZIONI
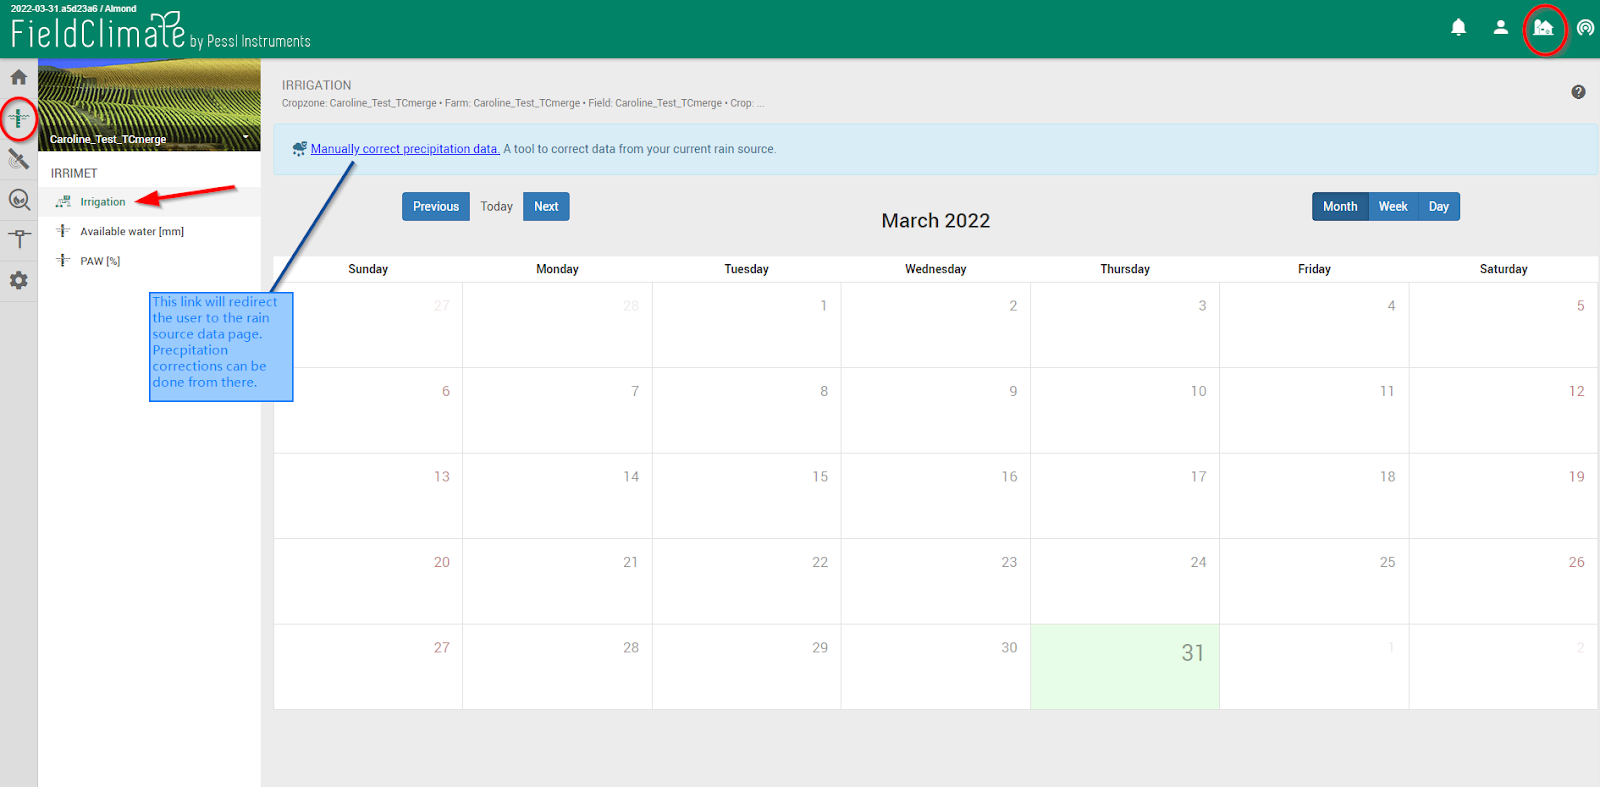
Questo strumento consente agli utenti di correggere i dati di precipitazione da qualsiasi fonte pluviometrica (stazioni fisiche o virtuali). La correzione deve essere effettuata sulle rispettive righe, per il periodo di tempo selezionato, e poi calcolata tramite il pulsante "APPLICA". Una volta applicate, le modifiche sono immediatamente visibili su tutte le pagine dei dati e, allo stesso modo, sulle loro applicazioni.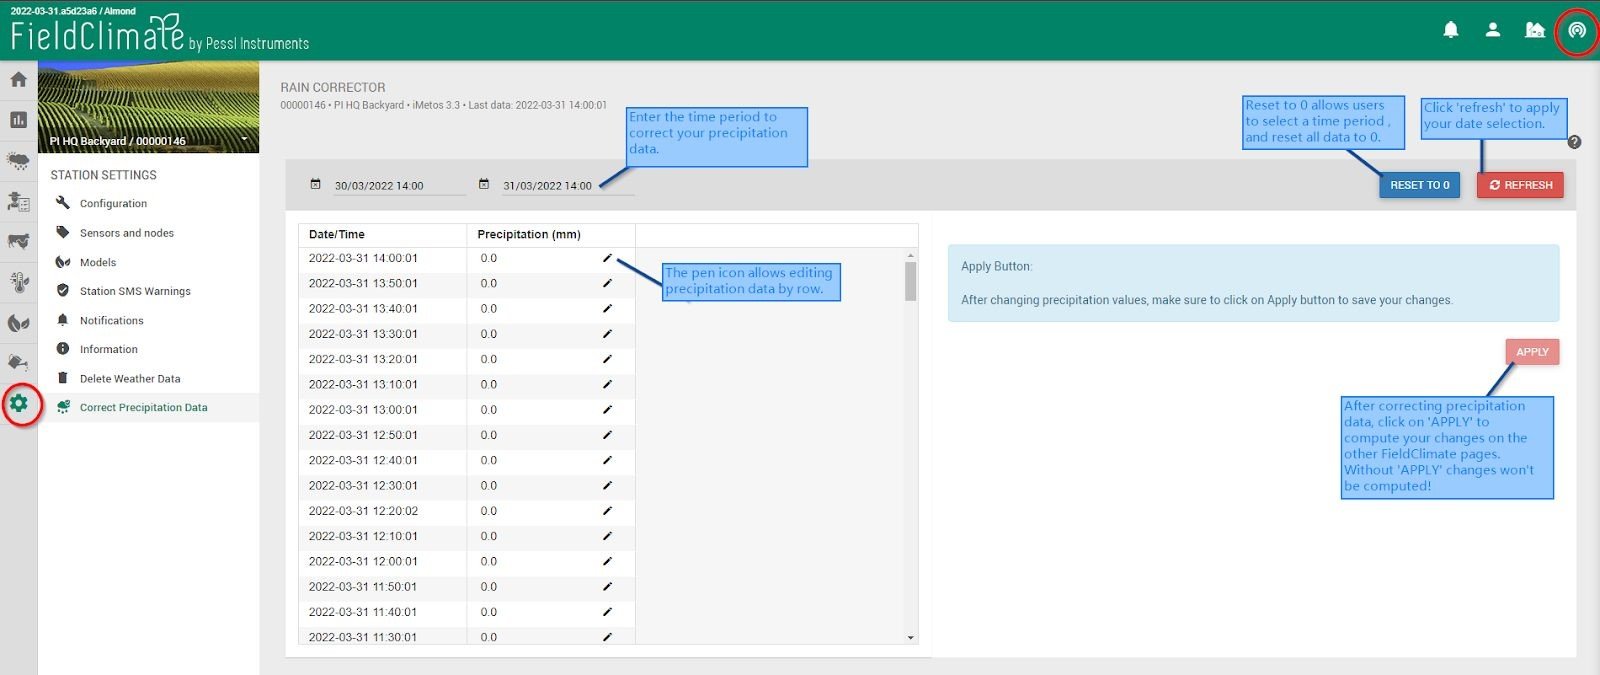 È possibile accedere a "Correggi dati di precipitazione" anche dal modulo FarmView Irrimet.
11.7 MODALITÀ DI MONITORAGGIO DEL GELO
Questa funzione consente di impostare automaticamente intervalli di trasferimento più brevi (5 o 10 minuti invece di 1 ora) durante le condizioni di gelo, solo quando il valore della temperatura scende al di sotto dei 5°C. Ciò consente una gestione più efficiente e intelligente della batteria, aumentandone le prestazioni, e fornisce dati in tempo reale dei principali parametri di congelamento. Gli utenti non dovranno preoccuparsi di modificare le impostazioni dell'FieldClimate, ma tutto sarà automatico!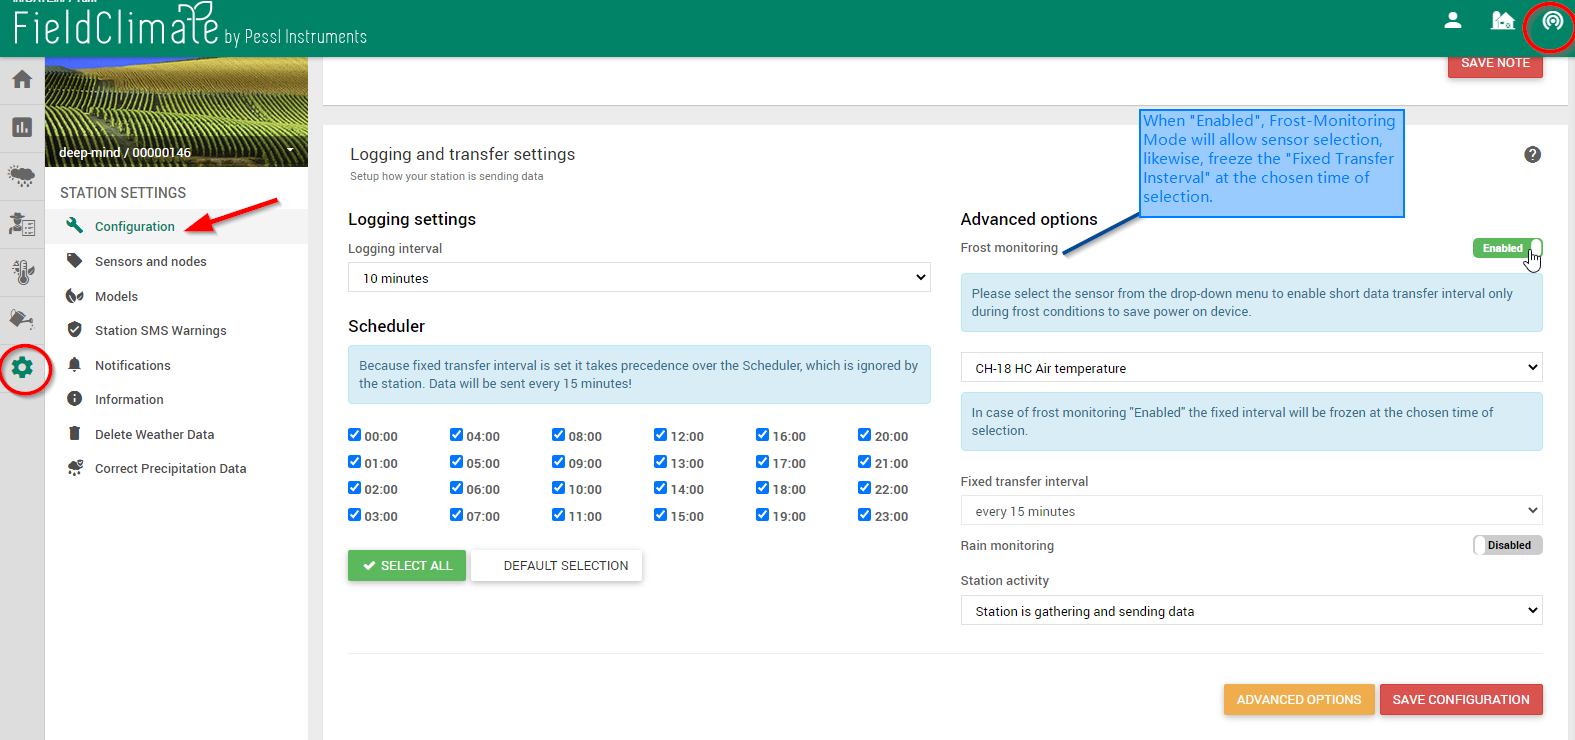
12. PAGINE DI VISUALIZZAZIONE DEI DATI DI CAMPIONAMENTO
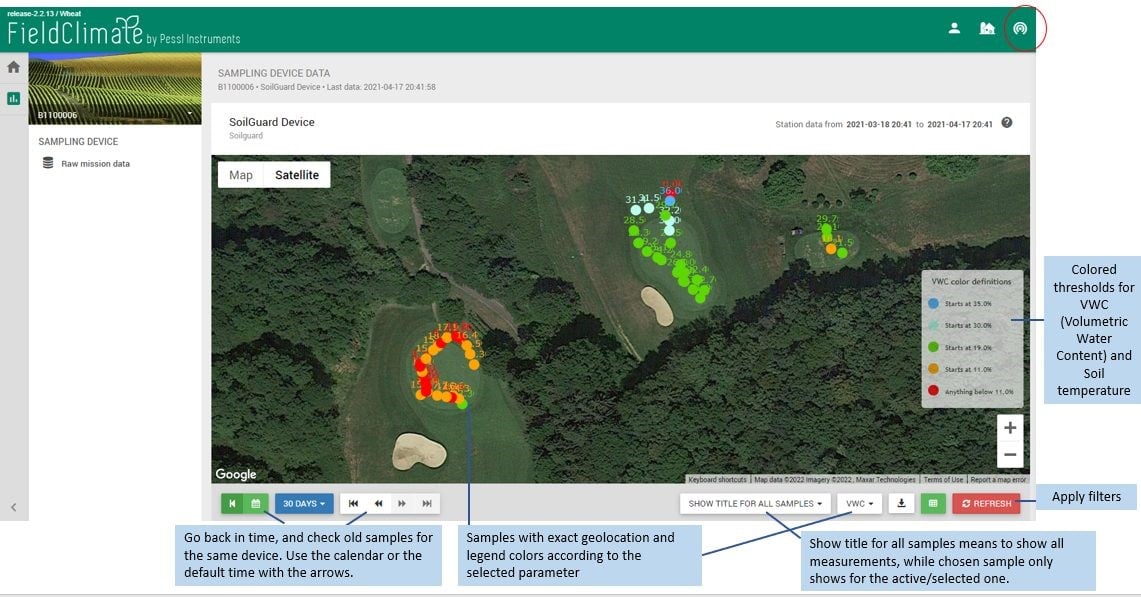
12.1 VISUALIZZAZIONE DEI DATI DI CAMPIONAMENTO SoilGuard
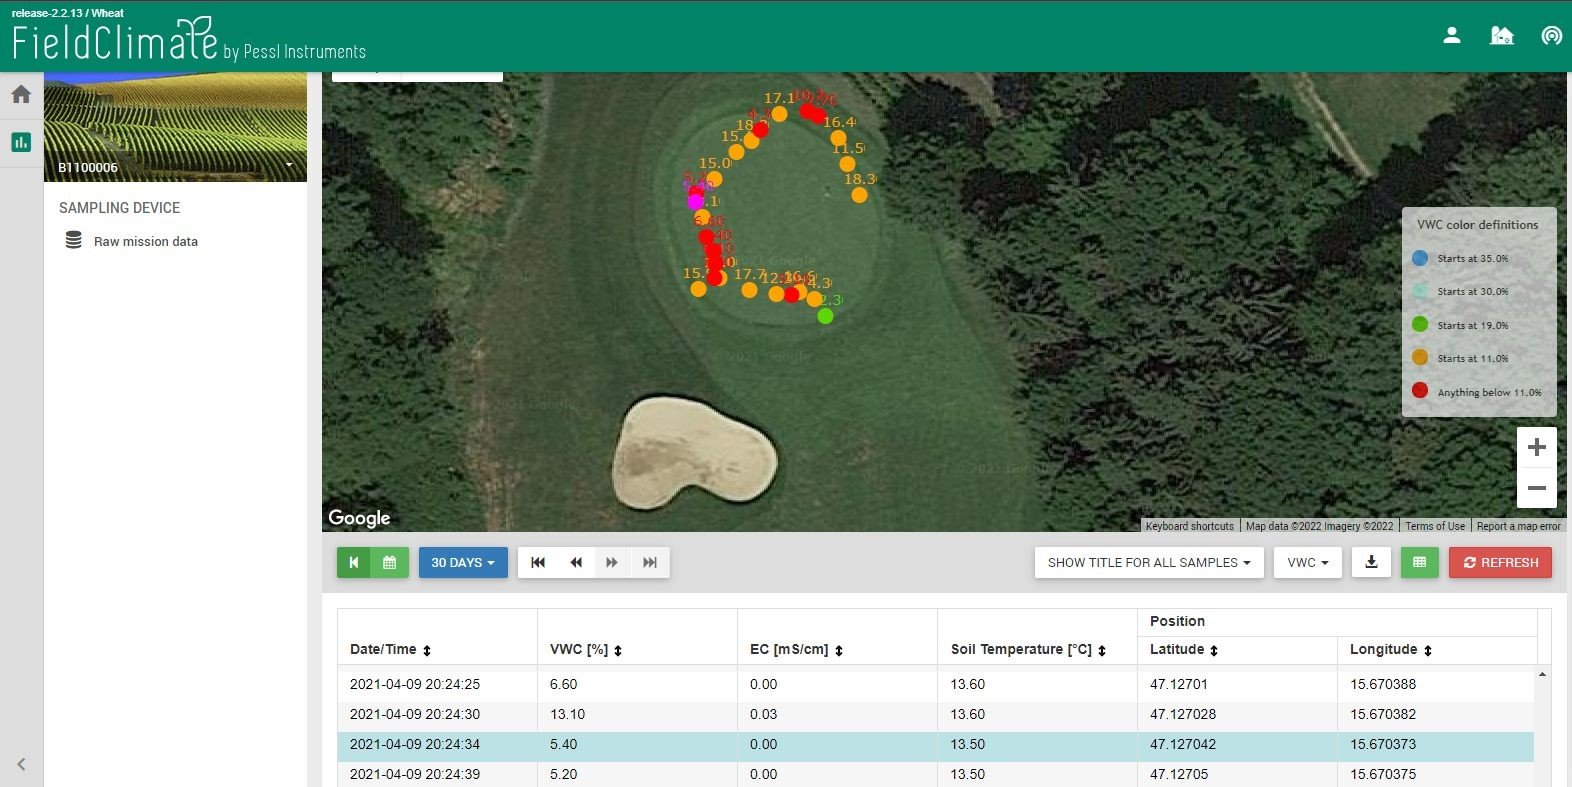
Dopo aver caricato i dati SoilGuard sul PC, tramite il menu Utente -> caricamento dati -> caricamento file CSV, sarà possibile visualizzare i dati di campionamento SoilGuard. I file possono essere importati solo in formato CSV.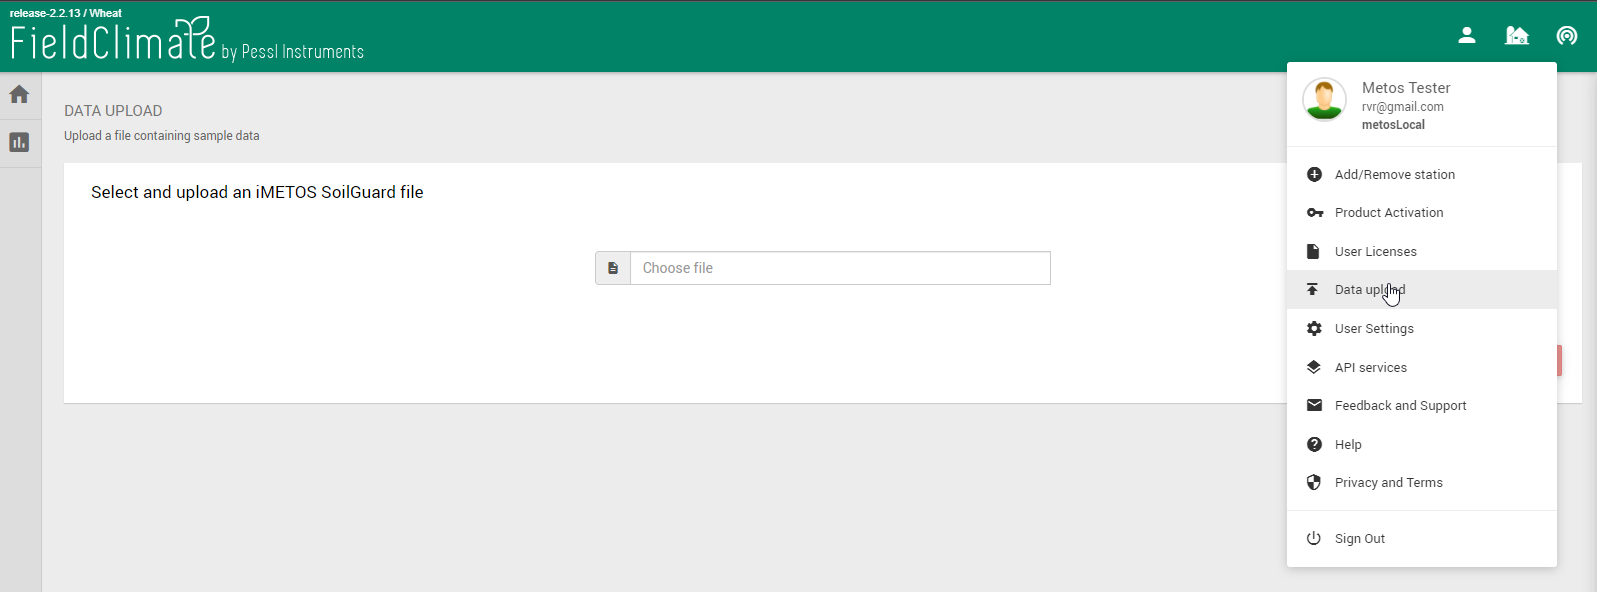 I dati consistono nella geolocalizzazione di tutti i campioni sulla mappa, con una tabella di dati grezzi in fondo alla pagina. Per visualizzare la posizione precisa, non dimenticate di attivare la localizzazione GPS sul dispositivo SoilGuard prima di iniziare la raccolta dei campioni sul campo.
Il campione selezionato (viola) può essere scelto in qualsiasi momento. Le rispettive misurazioni saranno mostrate nella tabella dei dati grezzi, evidenziate in blu.
I dati consistono nella geolocalizzazione di tutti i campioni sulla mappa, con una tabella di dati grezzi in fondo alla pagina. Per visualizzare la posizione precisa, non dimenticate di attivare la localizzazione GPS sul dispositivo SoilGuard prima di iniziare la raccolta dei campioni sul campo.
Il campione selezionato (viola) può essere scelto in qualsiasi momento. Le rispettive misurazioni saranno mostrate nella tabella dei dati grezzi, evidenziate in blu.
12.2 Dati di campionamento Dualex
Il caricamento dei dati per i dispositivi Dualex può essere effettuato tramite il menu Utente -> caricamento dati -> caricamento file CSV. I dati più recenti saranno visibili sulla mappa con la possibilità di tornare indietro nel tempo tramite il calendario e/o le frecce di navigazione.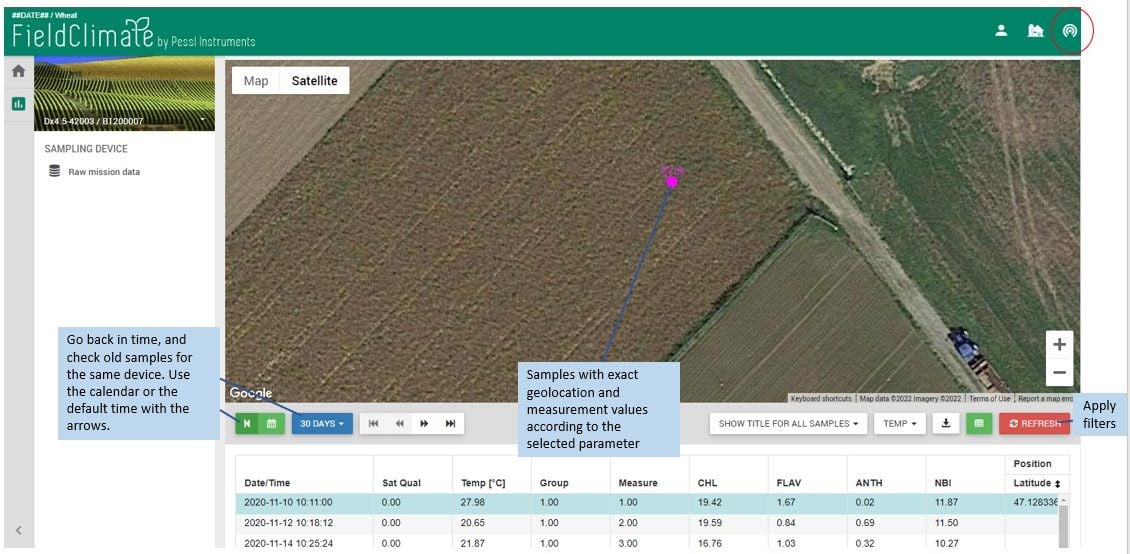
12,3 CAMPIONI MobiLab
12.3.1 Come caricare i dati dall'MobiLab?
I dati dell'MobiLab possono essere caricati tramite l'applicazione mobile: Campionatore MobiLab disponibile per Android e iOS versione. Di seguito sono riportati i passaggi da seguire: 1- Scaricare l'applicazione MobiLab per iOS o Android; 2- Registrate le vostre sedi campione sull'app, creando rispettivamente ID individuali per ciascuna di esse; 3- Scaricare il file Software per desktop da MobiLab sul computer; 4- All'interno del Desktop Software, eseguire le misure per il suolo o per il Plant SAP; 5- I risultati vengono visualizzati sul Desktop Software. Per ulteriori informazioni, consultare il manuale. 6- Per visualizzare i dati nel FieldClimate gli utenti devono sincronizzare i dati dal software desktop al server FieldClimate.12.3.2 Come visualizzare i dati MobiLab in FieldClimate?
Una volta effettuata la sincronizzazione dei dati, è possibile accedere ai dati dell'MobiLab tramite l'elenco delle stazioni o tramite l'elenco delle cropzone nel caso degli utenti di FarmView. Per la prima opzione, la visualizzazione dei dati sarà questa: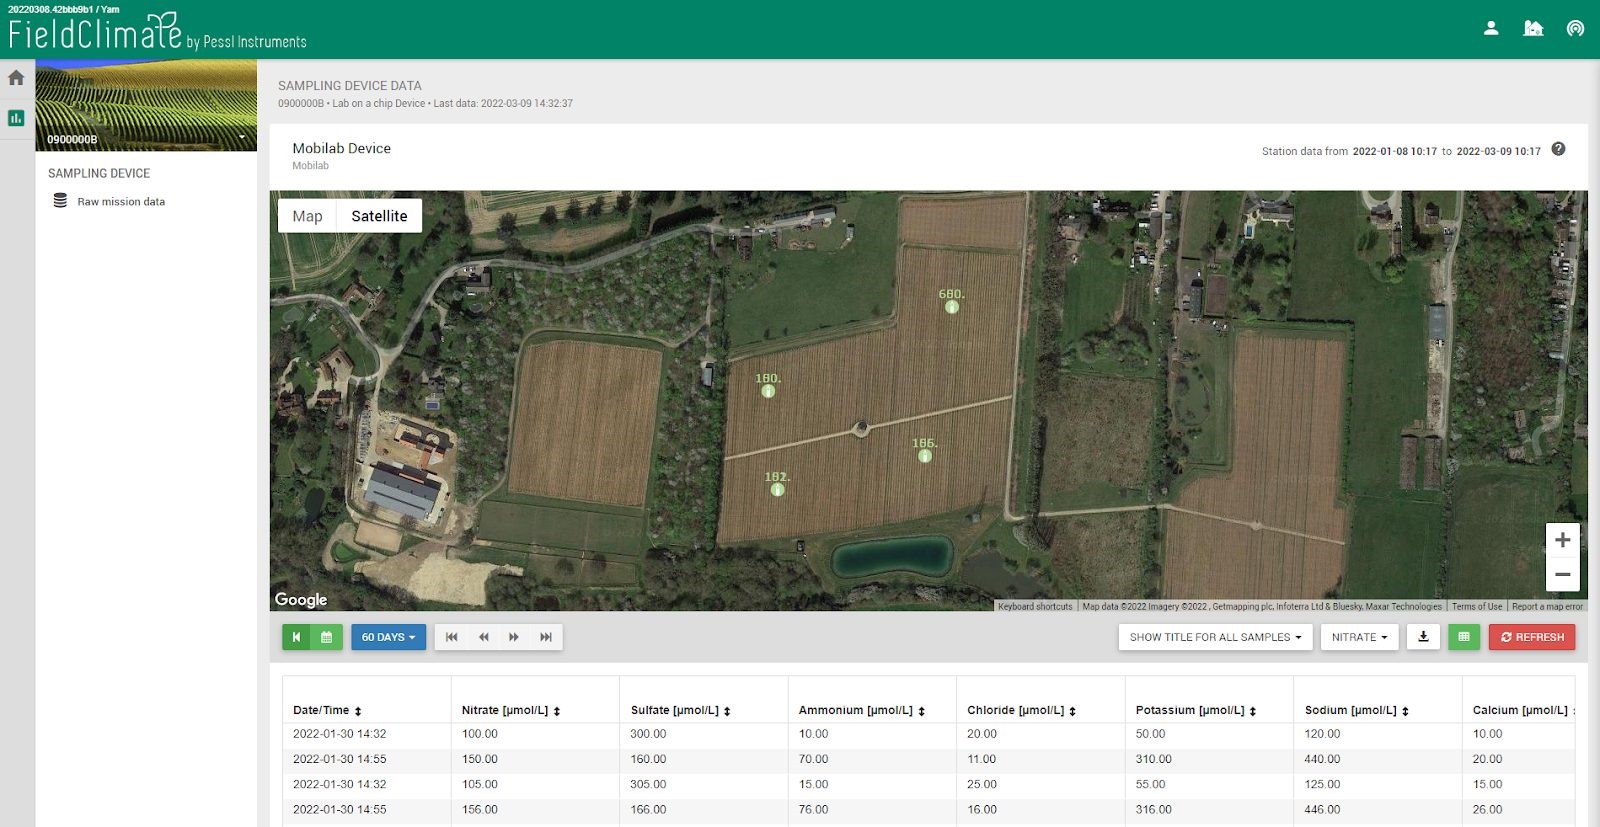
13. SENSORI CALCOLATI
13.1 SENSORI VIRTUALI
I sensori virtuali forniscono letture di proprietà fisiche non misurate direttamente ma derivate dalle letture di altri sensori.13.1.1 EVAPOTRASPIRAZIONE
L'evapotraspirazione giornaliera ET0 è calcolata con l'equazione FAO-56 Penman-Monteith e necessita di misure (sensori) di:- Temperatura dell'aria
- Umidità dell'aria
- Radiazione solare
- Velocità del vento
13.1.2 VPD
Il deficit di pressione di vapore richiede un sensore igroscopico (temperatura dell'aria e umidità relativa) ed è in stretta relazione con l'evapotraspirazione. Il VPD è un'indicazione che tiene conto dell'effetto delle temperature sulla capacità di trattenere l'acqua dell'aria, che è ciò che determina la traspirazione della superficie fogliare (la traspirazione avviene quando la pressione dell'acqua nelle foglie è superiore alla pressione del vapore dell'aria). Pagina dei sensori virtuali.13.1.3 PUNTO DI RUGIADA
Richiede un sensore di temperatura dell'aria e di umidità relativa ed è la temperatura alla quale il vapore acqueo presente nell'aria si condensa per formare un liquido o è la temperatura alla quale l'aria si raffredda quando si forma la rugiada. Per informazioni più dettagliate, visitare il sito Pagina dei sensori virtuali.
13.1.4 DELTA T
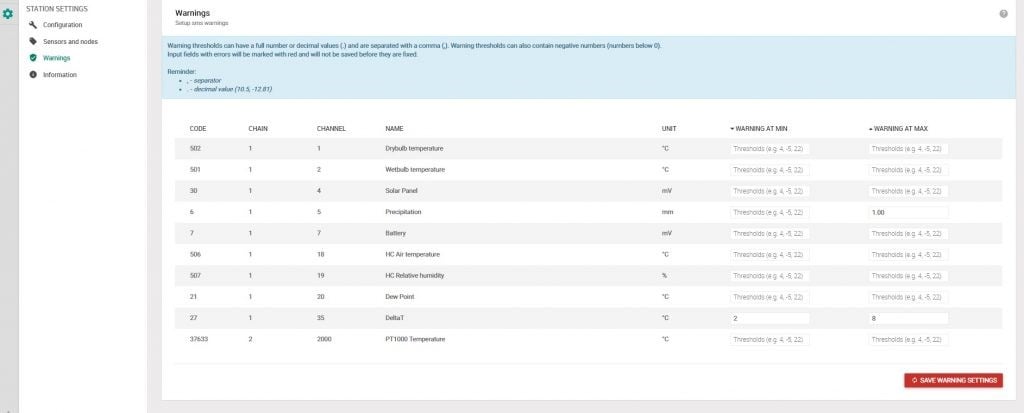
Il calcolo del Delta T richiede un sensore hygroclip (temperatura dell'aria e umidità relativa) installato sull'METOS.® stazione: i dati possono essere visualizzati sull'FieldClimate in grafici e tabelle con una risoluzione dettagliata. È una misura che tiene conto degli effetti combinati di temperatura e umidità e indica se le condizioni climatiche sono adatte all'irrorazione per massimizzare le prestazioni dei pesticidi (A. MacGregor, 2010). L'intervallo ottimale di Delta T è compreso tra 2°C e 8°C. Continuare a monitorare la lettura del Delta T e impostare un'irrorazione efficiente nei tempi previsti. Le condizioni meteorologiche possono cambiare rapidamente nel corso della giornata, quindi la possibilità di monitorare il delta T può aiutare a migliorare le prestazioni del pesticida. DELTA IN CAMPO CLIMATICO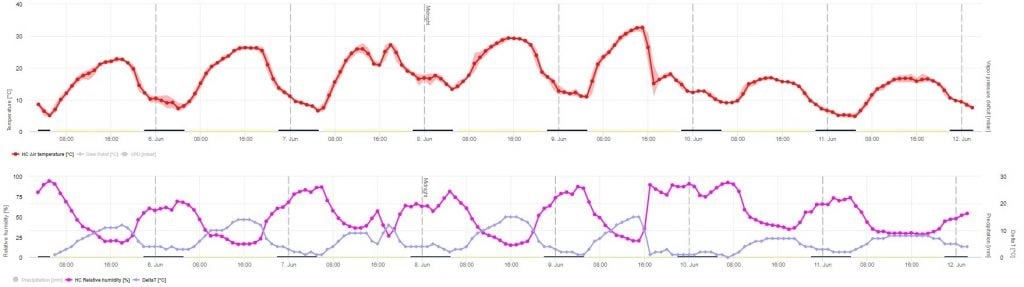 IMPOSTARE GLI AVVISI SMS DELTA T
Prima di ogni irrorazione è necessario effettuare una lettura delle condizioni meteorologiche in loco; in particolare, è sempre consigliata una lettura in tempo reale del Delta T. Impostare una soglia minima o massima per gli avvisi via SMS. La lettura live del Delta T viene aggiornata ogni 5 minuti.
IMPOSTARE GLI AVVISI SMS DELTA T
Prima di ogni irrorazione è necessario effettuare una lettura delle condizioni meteorologiche in loco; in particolare, è sempre consigliata una lettura in tempo reale del Delta T. Impostare una soglia minima o massima per gli avvisi via SMS. La lettura live del Delta T viene aggiornata ogni 5 minuti.
 Per informazioni più dettagliate, visitate il sito Pagina dei sensori virtuali.