
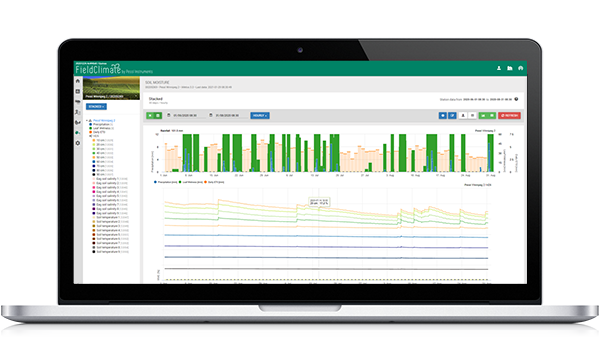
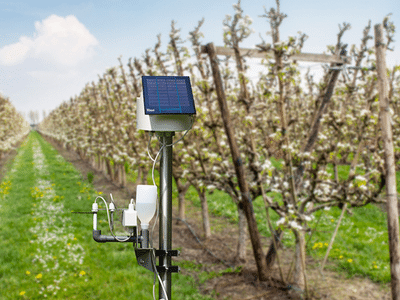
The robust and reliable METOS® weather stations have been used by many wines, apple, and vegetable growers worldwide for decades.
Where irrigation is needed, Pessl Instruments also recommends the installation of soil moisture sensors, sold under the METOS® brand name, to save water and costs. METOS® hardware comes with a software solution for data monitoring and decision-making processes – Fieldclimate.
In this article, we want to introduce you to a new add-on of Fieldclimate called Farmview. With Farmview we are offering our users the ability to administer fields and crop zones, calculate evapotranspiration models, see upcoming water stresses and manage irrigations for a given crop in given borders. In addition, the FarmView tool enables you to see the effect of irrigation, weather and soil moisture with help of stationary and virtual stations as well as with satellite data.
Focus on widgets and mapping
In FarmView we bet on overview widgets and mapping widgets enabling you to view, filter and sort your fields. We are convinced that such tools make the decision support more user-friendly. After defining your farm, field, crop zone and its borders you are provided with an overview page of all crop zones/fields and their basic characteristics. From here on, you can easily update or delete crop zones, filter them and see which are active and which are not.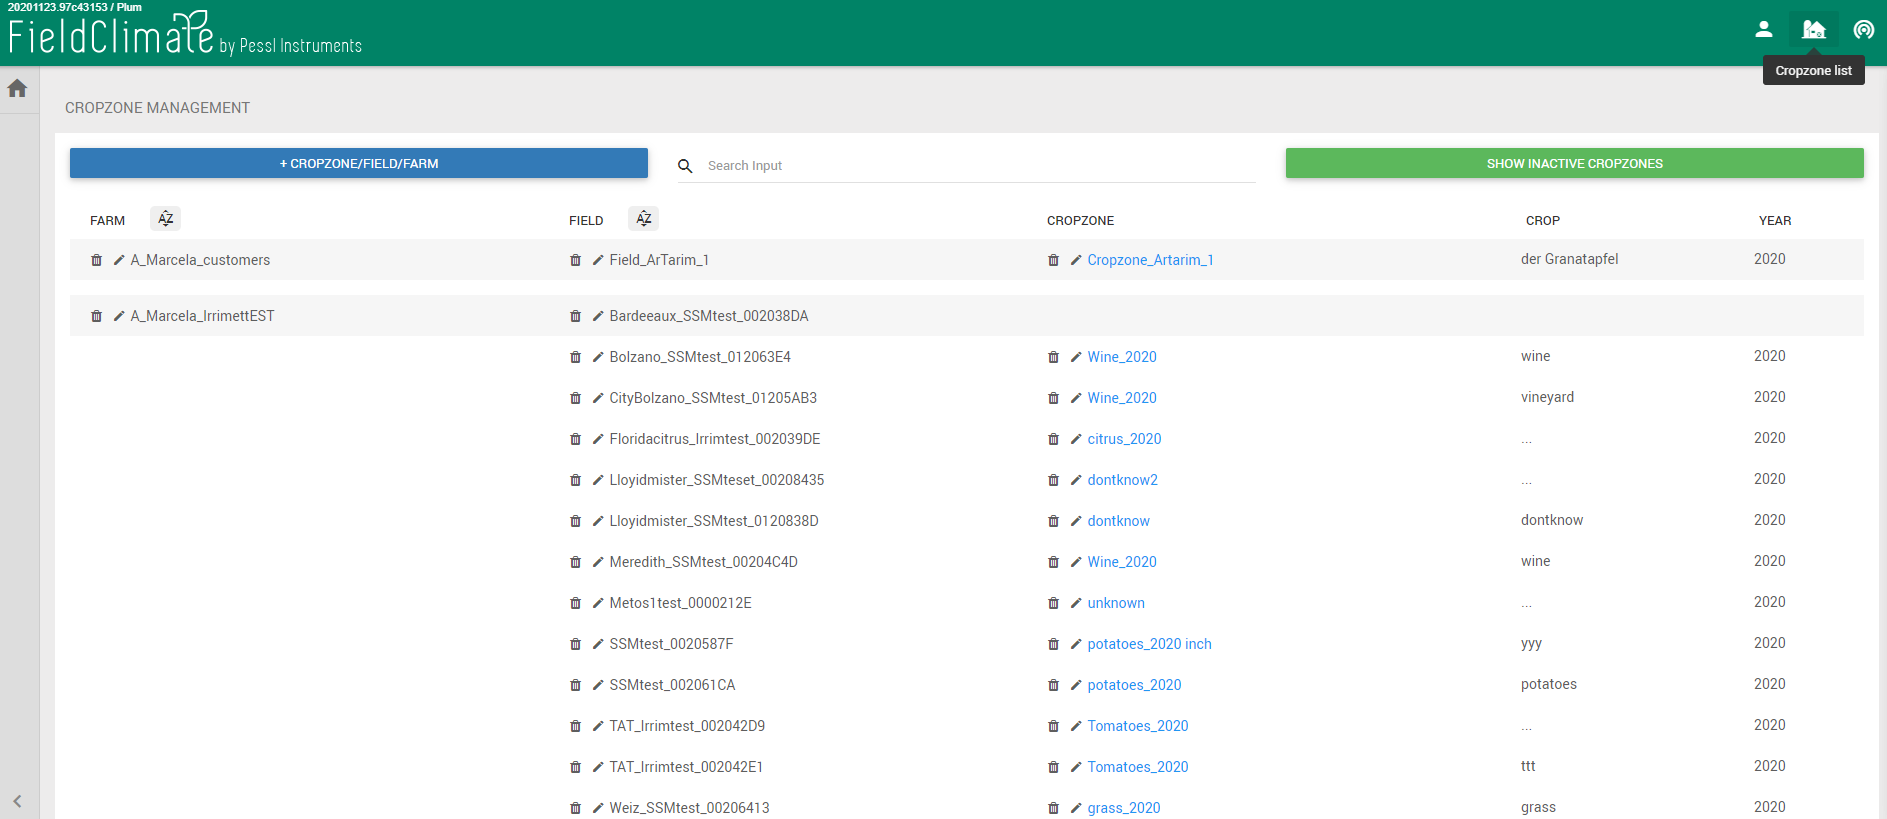
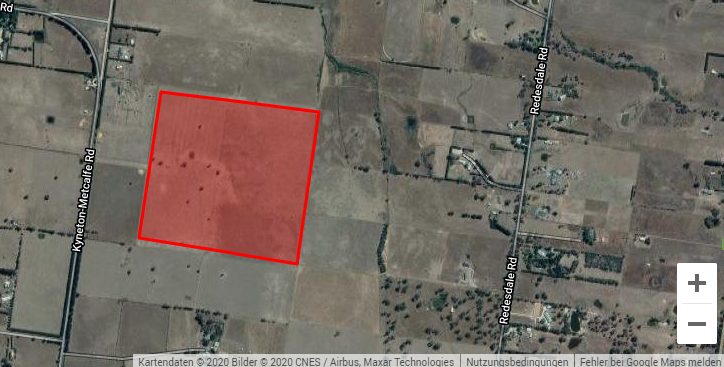
Figure 1. Example of the FarmView management page.
The water-use widget offers you the latest water status of your fields. This can be modelled or measured depending on which sensors you installed in your field or which virtual stations you purchased. The widget also gives an option to prioritize fields that require your attention. The accompanying map displays the values in space.
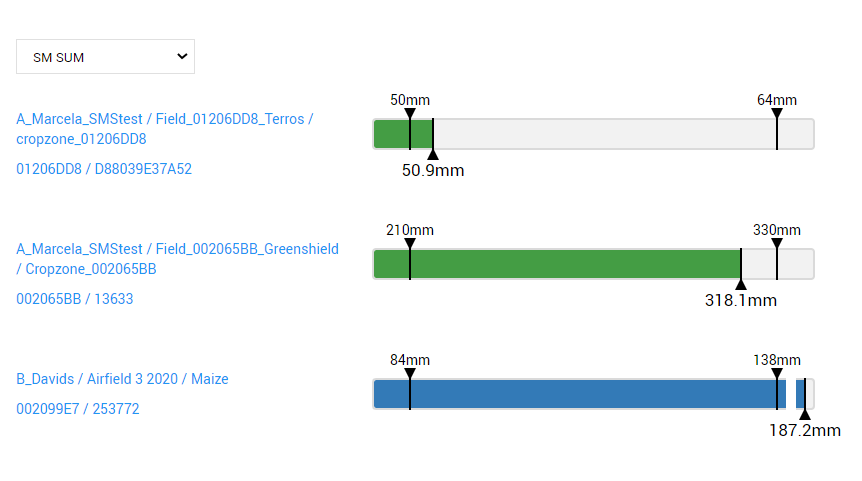
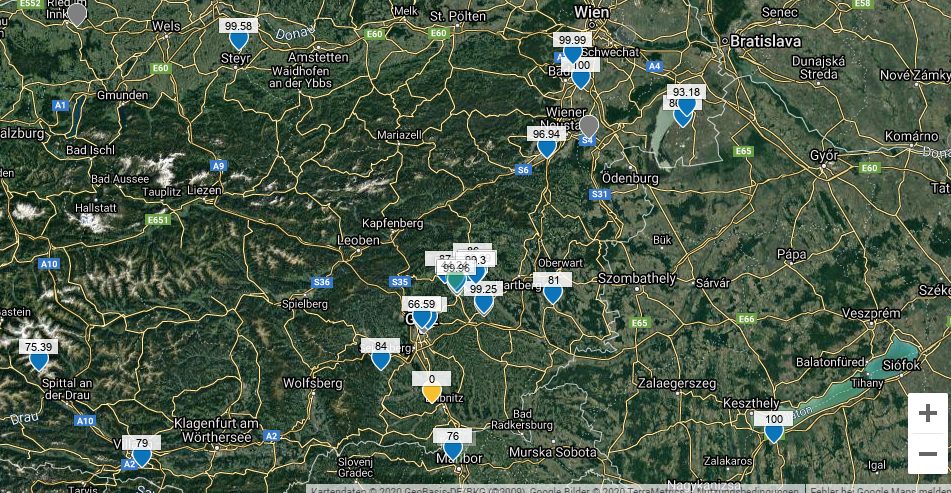
Figure 2. Example of the FarmView widget displaying soil moisture sum in mm and the mapping widget displaying relative PAW.
Monitor crop water use and do detailed irrigation decisions
Independent of which sensors you installed or which virtual stations you purchased, FarmView can answer your question about crop water use. Using the FarmView Irrimet module you can model the moisture with the use of your METOS rain and evapotranspiration sensors or virtual sensors using a simple water balance model. Using Soil moisture tools within FarmView, you measure the actual water with the help of your soil moisture sensor. All results can be displayed in mm of water or % of Plant Available Water ( PAW). Using mm, you have the ability to see the actual water deficit and thus easily decide about the water needed for irrigation.
If you decide to purchase soil moisture multiple-depth sensors, FarmView will offer an additional option to analyse each depth separately, again in % or mm. Yet another plus of having soil moisture sensors is that you can sum up depths relevant to your crop at a given growth stage (Figure 3).
The water balancing algorithm is using the Penman-Montheith-based evapotranspiration. The algorithms are transparent and well described in the software help and video tutorials.
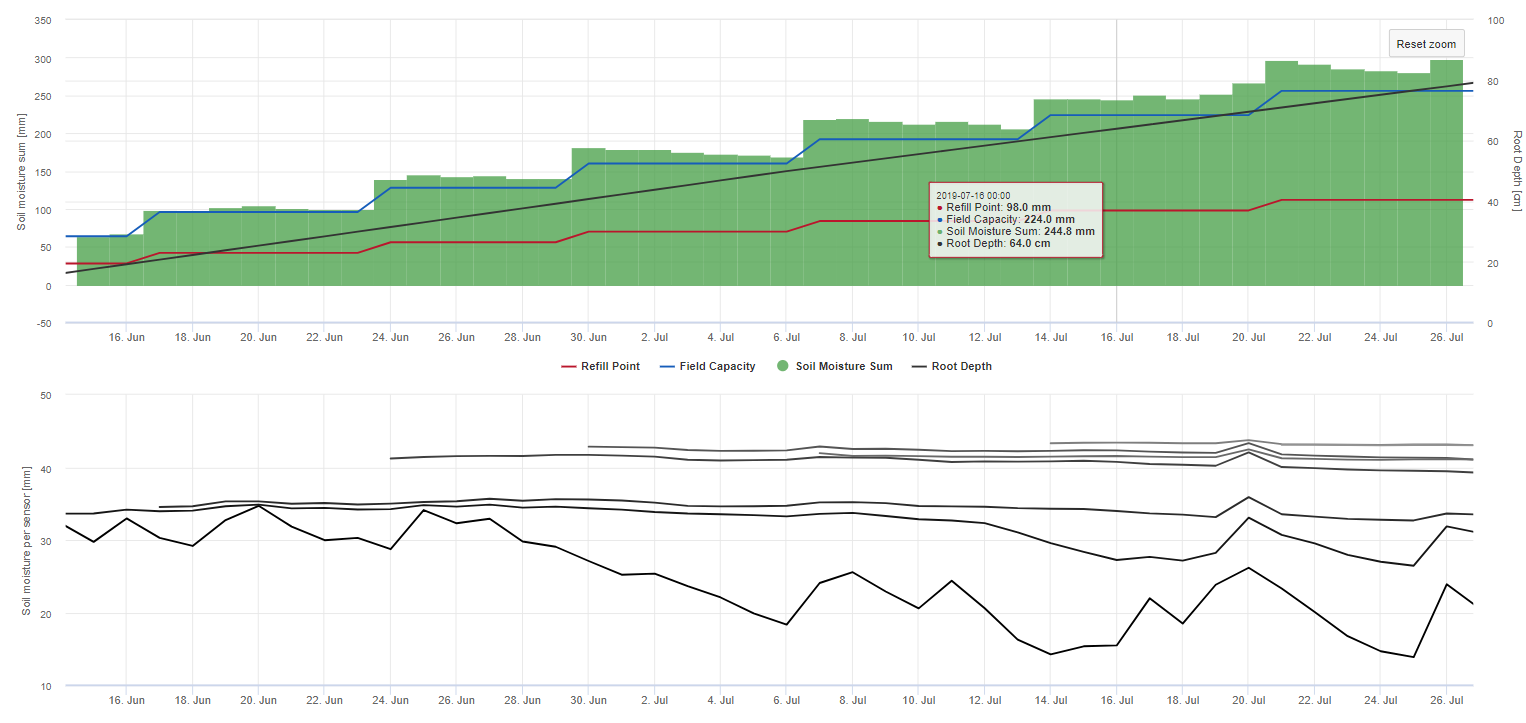
Figure 3. Soil moisture from multiple-depth sensors (below) and the soil moisture sum (above) are shown for different root depths stages.
Combining the above tools with your experience, you decide about timing and the amount for irrigation according to a given crop stage. FarmView accompanies you even further – during inputting and storing of irrigation amounts. A google-like-calendar offers input functionality for sprinkler, pivot, flood as well as drip technologies. This is then immediately taken into account in crop water use calculations.
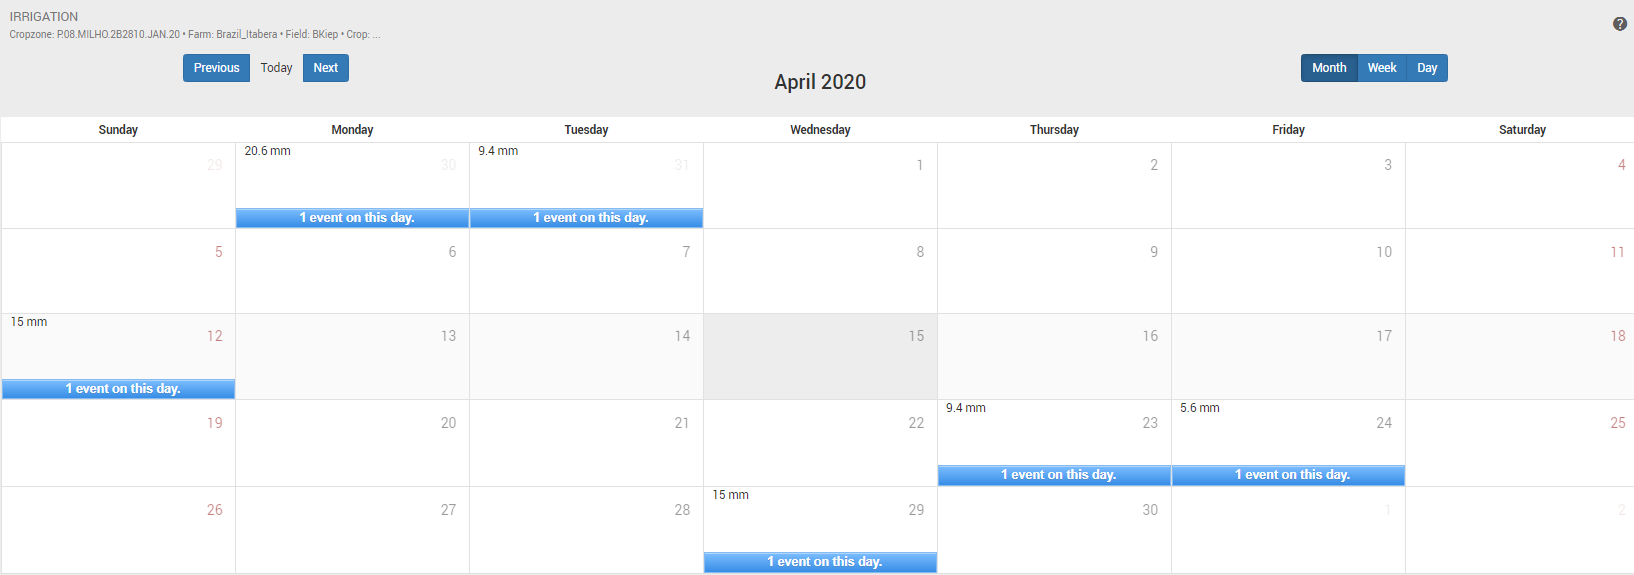
Figure 4. Irrimet calendar enabling input of regular or single irrigation events.
Scouting with satellite
To further boost the FarmView functionalities we decided to ingest satellite data using Sinergse Sentinel-Hub services. We started up with optical Sentinel-2 worldwide-available data and, according to future demands, we are capable of also adding high-resolution data (e.g.Planet Lab) or microwave data to monitor soil moisture.
The big advantage of satellite Sentinel-2 data is not only, as often advertised, high spatial resolution but also its high revisit. Some areas of the world get images every third day. Using this information together with current and historical METOS station data (using e.g. accumulated growing degree day (AcGDD) or precipitation), we can provide you with AI-based estimates of crop stages required in crop water use monitoring (as described in the previous chapter). Vice versa, we can judge the type of weather conditions during different crop stages, if sufficient GDDs were reached or how the weather could have impacted biomass in different years.
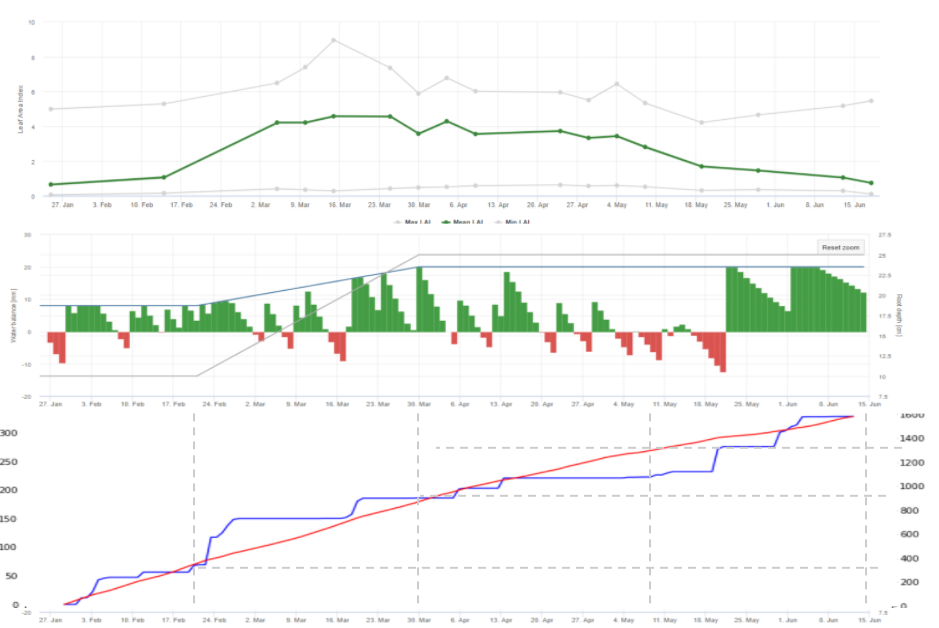
Figure 5. Example of biomass time-series over maize field in 2020 (upper graph) along with water balancing output (middle) and accumulated growing degree day and precipitation overplotted with different crop stages (below). Good quality corn is expected to reach LAI values of up to 6.
Next, the Sentinel-2 optical and mid-infrared data from early in the season are used during sampling for our nutrition sensors – Mobilab as well as for the vegetation sensor – Dualex.
Yet another great advantage of the Sentinel-2 data is its high spatial resolution of 10 m enabling viewing of biomass maps, generating management or application maps, and last but not least supporting you to detect effects of extreme weather events (e.g. freeze, hail, storms) or topography (Figure 6). It’s advisable to check the biomass status prior to each operation, if it’s spraying, irrigation, or harvest and again a few days after. The dense time series in vast regions of the world enable you to study effects within less than a week and enable you to act early. For instance, detecting a large portion of a field where seeding failed due to temperature or moisture stress, may motivate you to reseed again. Another
example may be a failure in irrigation technique on a field that is hard to access that can be detected within only a few days as an anomaly in the vegetation growth monitored by satellite.
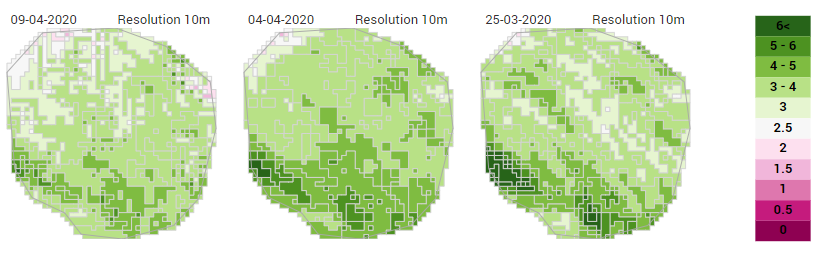
Figure 6. A maize field in central Brazil during late March and early April 2020. The decreased biomass in the northwestern portion of the field is due to an eroded hill. The stripes reflect terraces generated to obstruct the loss of water.
CONCLUSION and looking forward
FarmView service within Fieldclimate combines existing METOS® hardware and software with satellite data to deliver you a complex monitoring system of your fields in space and time. FarmView offers you a number of smart tools and widgets that enable the sorting of your fields based on actions needed for seeding, spraying, applying fertilizer, harvest, or other management strategies.
In this article, we introduced FarmView modules for crop water use monitoring – Irrimet and Soil moisture – and products based on Sentinel-2 satellite data. Our next goals are to provide outputs in form of mapping widgets with colourful schemes and provide Sentinel-2 soil and vegetation sampling maps. The next FarmView modules will be introduced in 2021 and will include disease monitoring, nutrition mapping, and tracker-based products.