A look at weather conditions and solutions for improved product efficiency and efficacy during spray operations

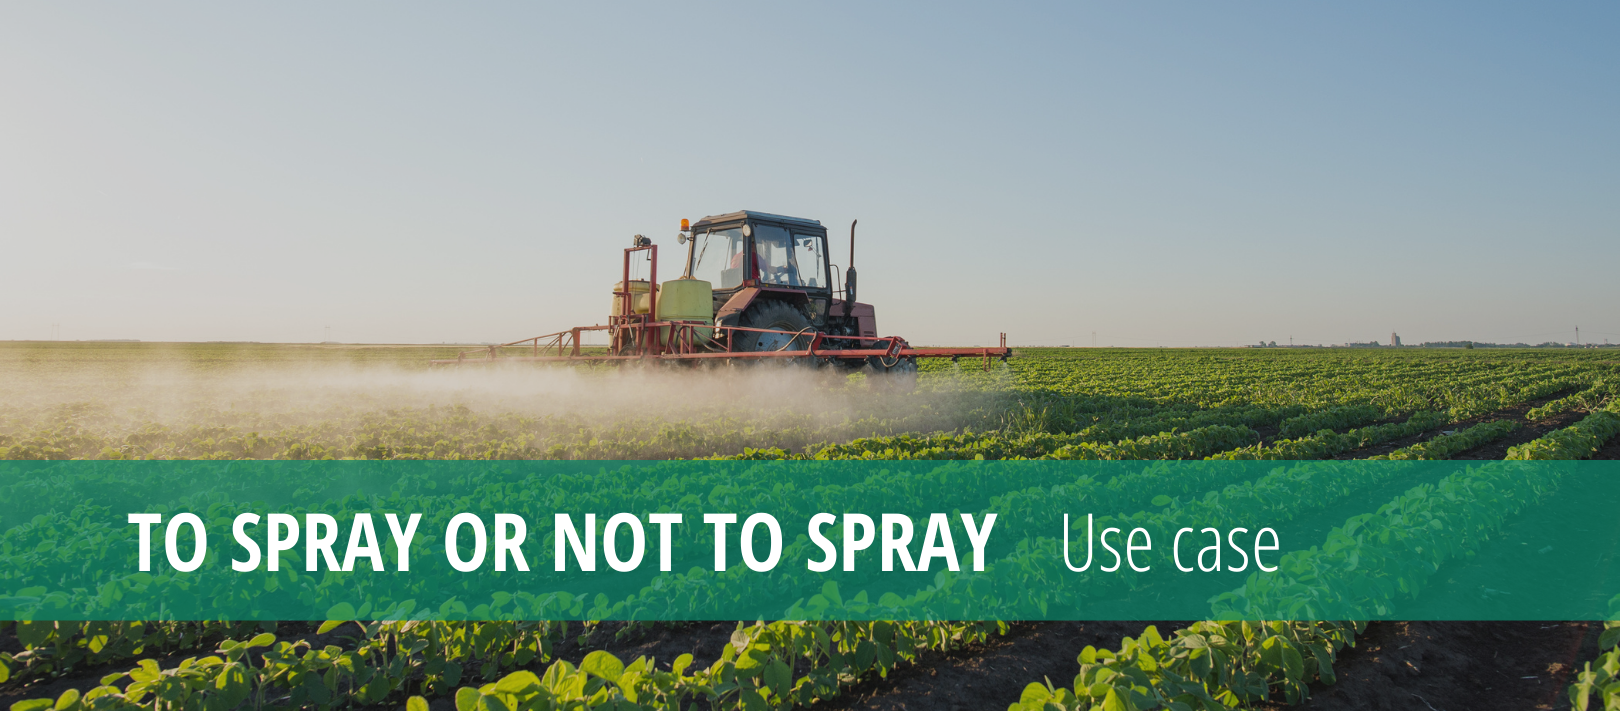
Use Case: To Spray or Not To Spray

It is the time of year when spraying becomes top of mind and the first thing done before spraying is check the weather conditions and forecast. With today’s IoT (Internet of Things) solutions for field monitoring this is easier than ever, in which a weather device can monitor the fields real-time conditions for spraying and provide a field specific hourly forecast of the conditions for the next several days.

Use case_To spray or not to spray_cover

A grower or agronomist no longer must use weather information that is 10’s of km from their field and updated only once an hour. Today’s field level weather information and forecast are further integrated into actionable tools for: plant protection, disease modelling, and alerting which is accessible on the desktop and mobile devices.

For any spray application, there are a few weather factors that must be considered for proper spray efficacy and environment concerns, especially with climate change and more importantly weather variability. These include wind speed, gust and direction, temperature and relative humidity (delta T), solar radiation (sun) and precipitation.

WEATHER GUIDELINES FOR EFFECTIVE SPRAYING

  • Read the product label and follow all label instructions
  • Spray when the wind is steady and between 5 to 20 kph
  • Avoid variable and gusty wind conditions
  • Avoid calm condition – small droplets can remain suspended and drift (evening and night)
  • Choose conditions when wind direction is away from sensitive areas
  • Avoid high temperatures – > 28C since pesticides can vaporize
  • Spray when Delta T is between 2 and 8 and no higher than 10 for medium spray and 2-12 for coarse quality spray
  • Avoid spraying when temperature inversion
    exits – after sunset
  • Check the forecast for the rain free period
  • Local geography can influence wind speed and direction
  • Record all conditions Australian Bureau of Meteorology

Wind

As we all know wind can vary greatly in terms of speed and direction over a geographic area and be impacted by local topography and obstacles. Very often we look at wind as a hinderance to spray operations: to windy and the wrong direction.

These conditions are important of course for spray drift and product efficacy, but the opposite situation of very light winds combined with temperature inversions can also lead to serious spray drift issues. Today however, there are many tools available for a grower or agronomist, from looking at field level real-time wind conditions to wind over a geographic area, which help address these concerns.

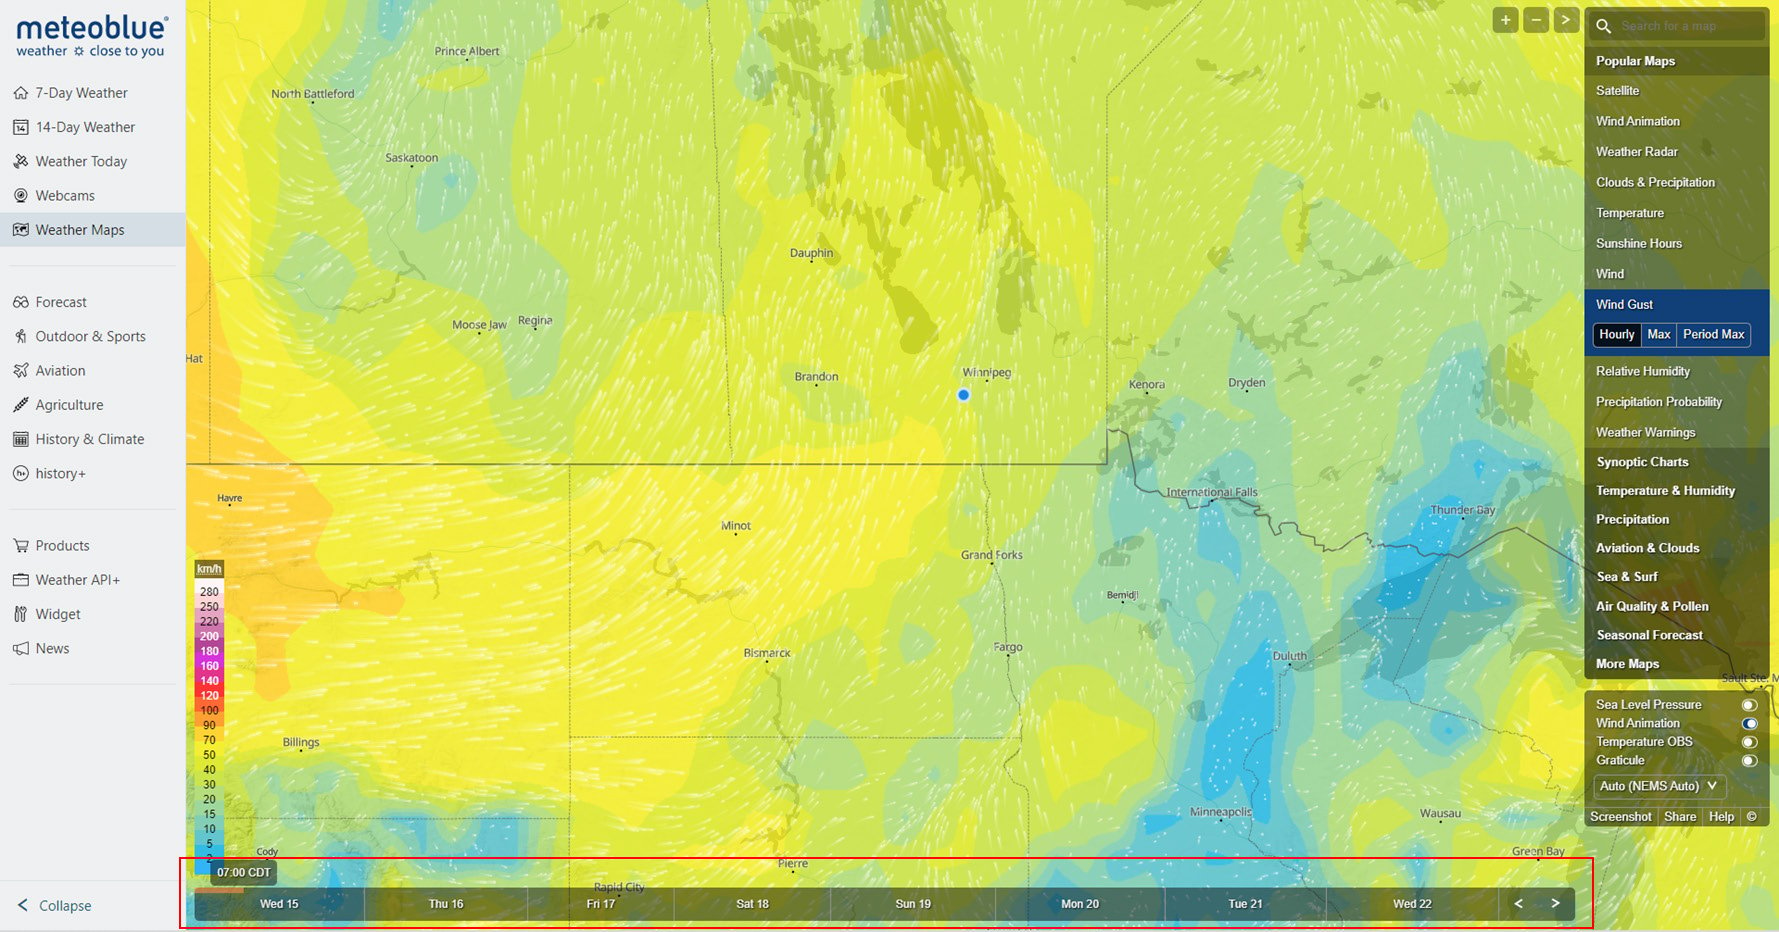
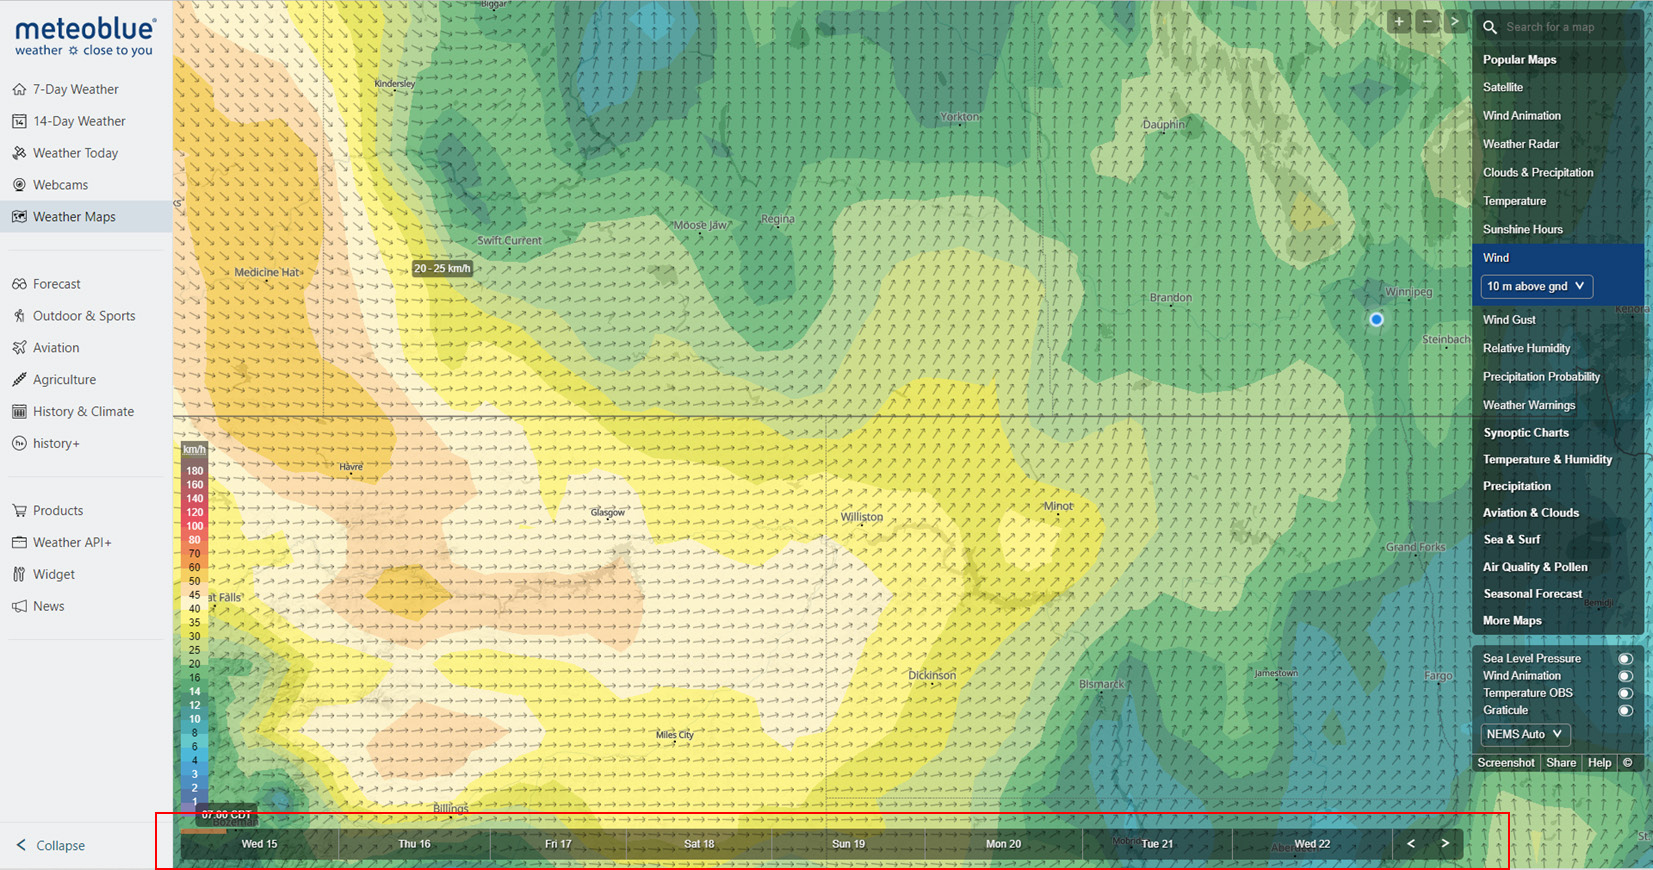
A tool for understanding the general geographic direction and speed of wind is meteoblue’s site for mapped wind and animation. You can select hourly or wind gust values and click the map for pinpoint values. This allows us to see what we can expect over the short term or click the animation tool to see the change in values for each hour over the next 7 days.

Use case - ROI - To Spray or not to Spray_picture2

Use case - ROI - To Spray or not to Spray_picture1
Fig. 1: Regional wind speed and direction from meteoblue, with hourly forecast display for the next 7 days

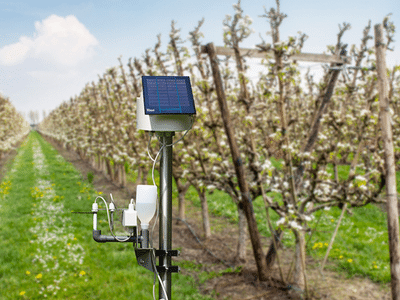
A user can further drill down, by having a site-specific weather station at the field, updating in near real-time. This will provide up to the minute detailed wind data for speed, direction, and gusts. Depending on the cellular communication, this can provide 10-minute updates on field conditions.

Use case - ROI - To Spray or not to Spray_picture3
Fig. 2: Field level wind speed, gust, and direction from FieldClimate, updated in 10-minute increments

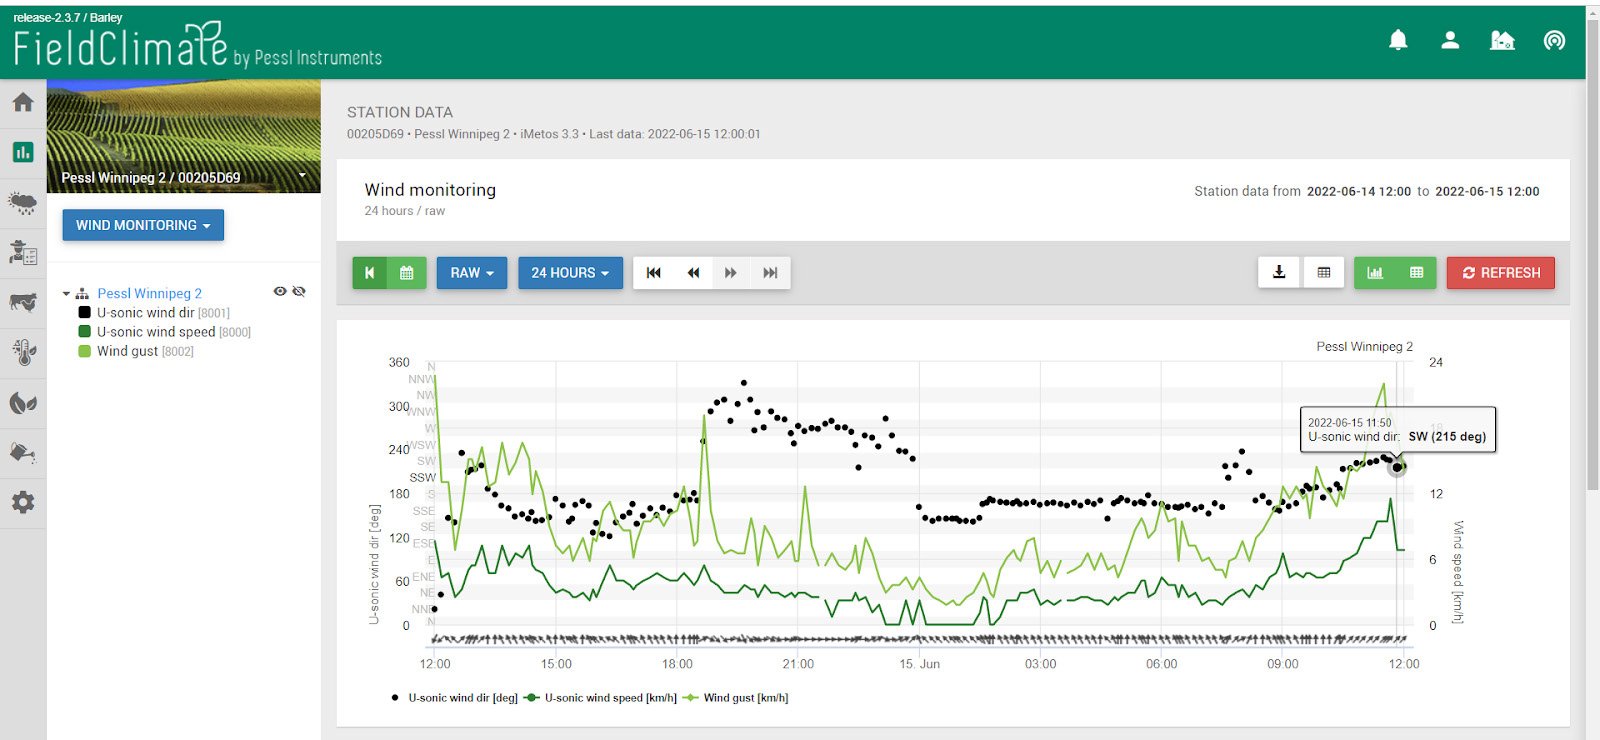
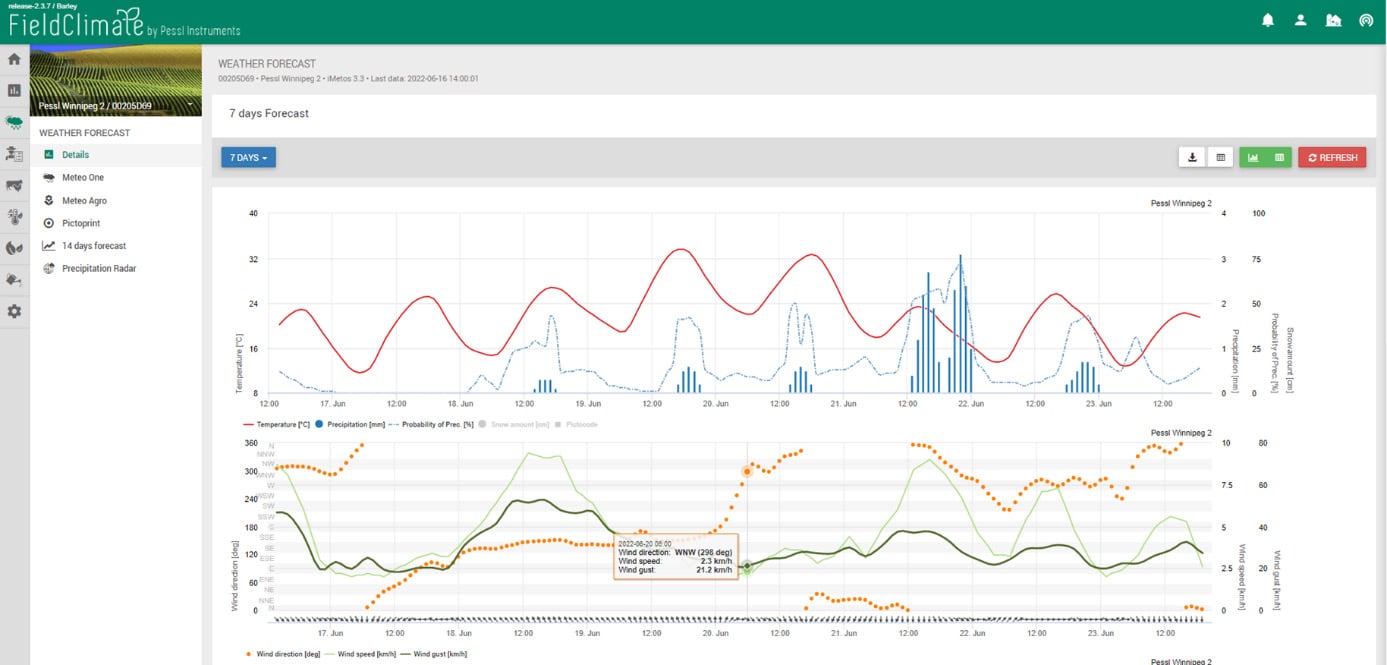
With in-field stations, site specific, hourly updated forecasts can be generated for that exact location. In this case, the stations sensors contribute to nudging and tuning the forecast, and the AI in the forecast learns the weather at that location over a couple month period, further fine tuning the forecast for the actual field location. This creates very accurate forecasts for the field.

Use case - ROI - To Spray or not to Spray_picture4
Fig. 3: Field specific, Hourly updated forecasts, showing forecasted wind speed, gusts, and direction for
spray planning

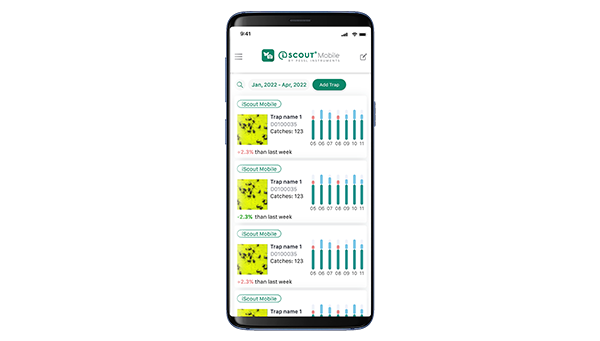
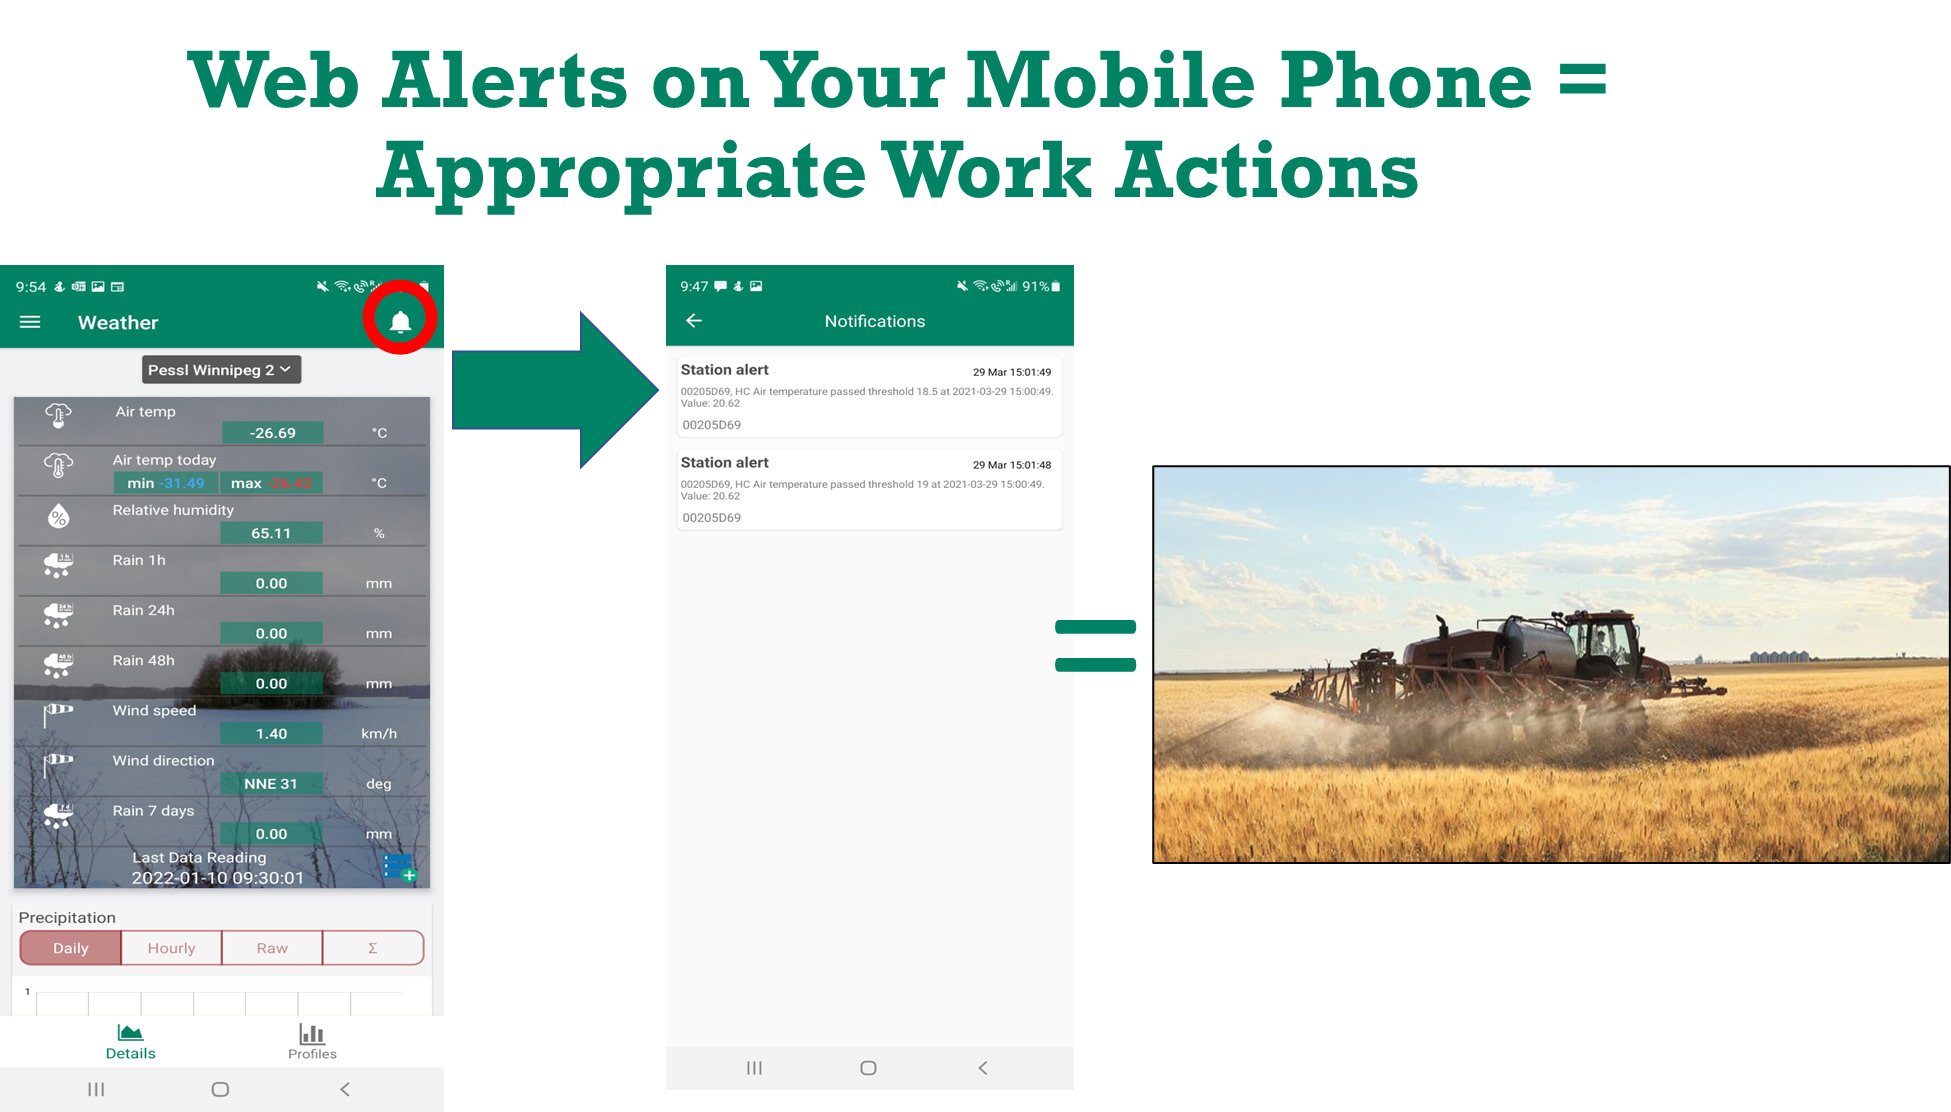
Notification of field level conditions can be delivered via SMS or Web Notifications. Both methods are delivered to mobile phone for notifications while a customer is on the go. The difference between the two methods is that SMS delivery can potentially incur an extra cost depending on your phone plan, while Web notifications are available through your current phone plans. The interesting point with IoT weather stations is that they are smart devices that can send SMS alerts to users directly, based on stored phone numbers that are setup in the desktop.

Use case - ROI - To Spray or not to Spray_picture5
Fig. 4: SMS alerts sent direct from the weather station to a user’s phone for any sensor or combination of
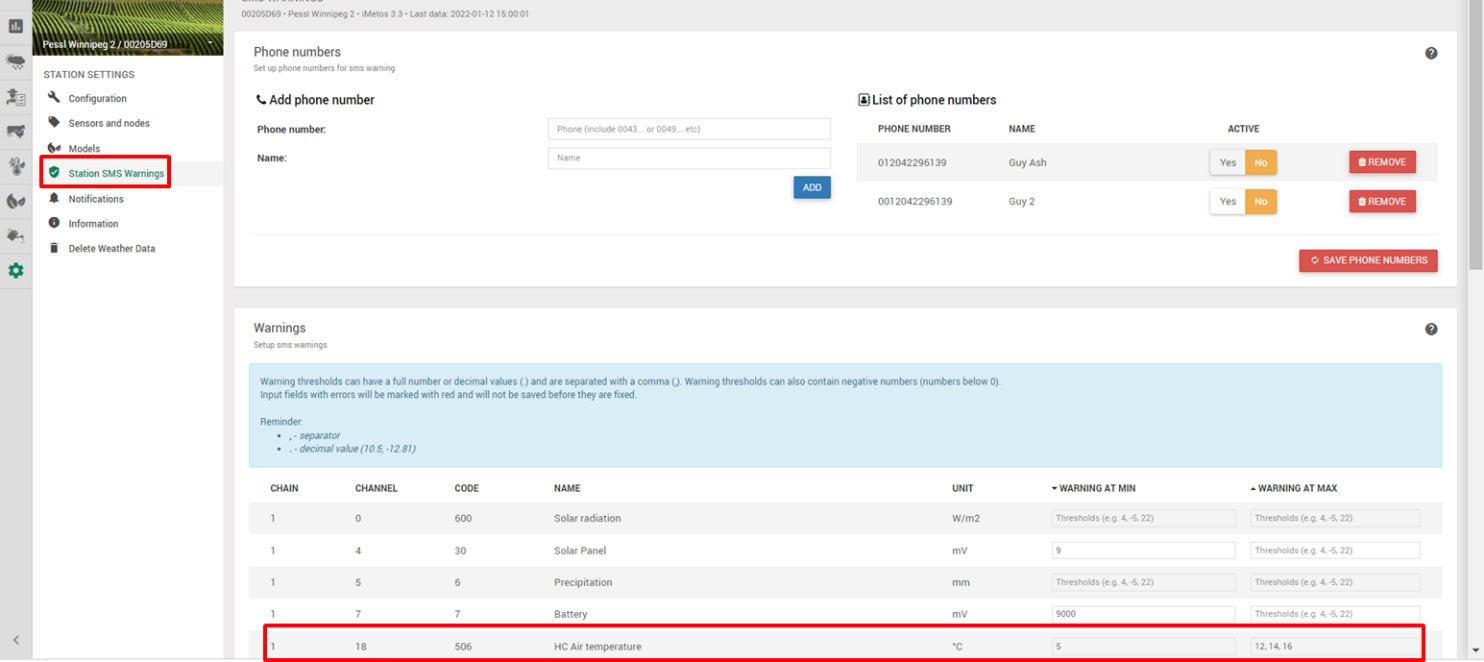
sensor and alert level
Use case - ROI - To Spray or not to Spray_picture6
Fig. 5: Web Notifications sent to a user’s desktop or mobile phone for any combination of sensor alert, e.g.,
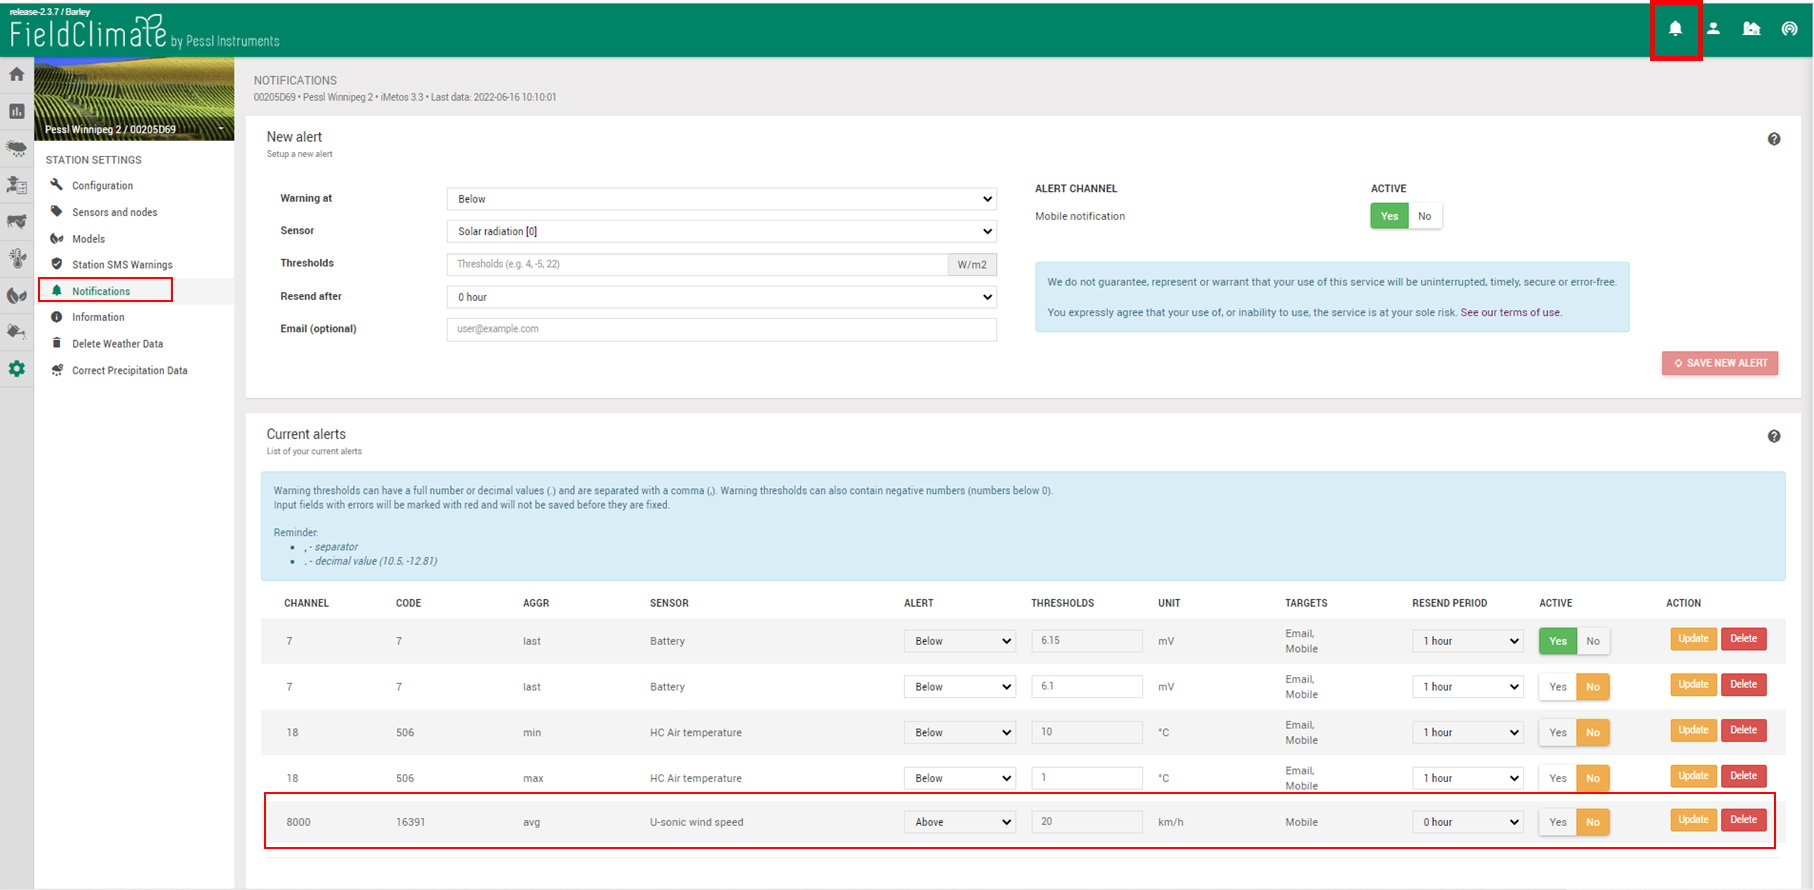
wind gust and direction. Note: The Bell on the desktop or phone is where alerts are accessed
Use case - ROI - To Spray or not to Spray_picture7
Fig. 6: FieldClimate Mobile, display of wind speed/direction and web notifications

What does all these tools mean?

They allow the grower or agronomist to have more exacting information on the current and future conditions for spraying.
This allows the user to adjust the spray schedule for the time of day of applications, required spray nozzles and water droplet size, boom height, and speed of application.

Note: Please remember that weather station in field will have windspeed/direction sensors installed at a height of 6 to 10 feet, so the drag and turbulence by the ground/crop will cause the wind speed/ gusts to be less than traditional wind speed measurements at airports.
Airports measure wind speed/direction at 10 meters or about 32 feet. If you would like to compare your stations values to airport measurements, there are ways to correct for the differences in heights.

Temperature and Relative Humidity or Delta T

Temperature – Temperatures at the ground can be much warmer than at sensor height temperatures. Volatile pesticides can release damaging vapors when exposed to high temperatures and low humidity’s, even when measured screen height (4 or 5 feet) temperatures are within acceptable levels. Generally, temperatures >28C should be avoided when spraying.

Humidity – Affects the evaporation rate, and we usually want humidity >45% for spraying. However, If the humidity is very high (>90%), droplet evaporation and absorption can be suppressed, and potential drift could take place. If the humidity is low (<45%) then droplet evaporation rapidly occurs and potentially could lead to spray drift. If the humidity is low and temperatures are high, then pesticides can convert to crystalline form and will settle on the target and not be absorbed or drift and can later be reactivated by additional moisture (residue levels). Optimal temperatures and humidity occur usually in early to mid-morning (not to hot or dry). The relationship between temperature and humidity is Delta T, which quantifies when spraying should and should not take place.

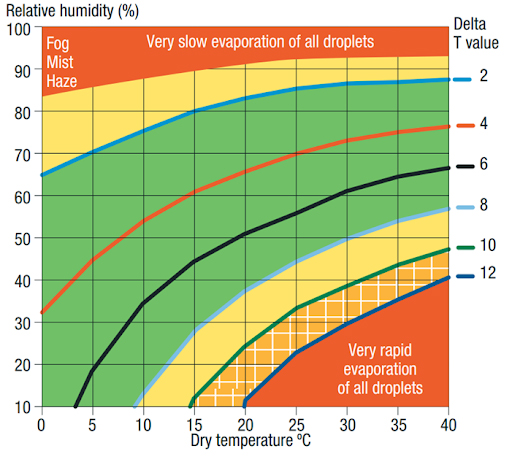
Delta T – Is becoming a standard indicator for suitable spray conditions. It’s indicative of evaporation rates and droplet survivability. It’s a relationship between dry and the wet bulb temperature OR air temperature and relative humidity.

A common spray guideline is to spray when Delta T is between 2 and 8, with caution below 2 or above 10. A Delta T value above 8 is associated with higher temperatures and lower humidity, if the value is lower than 2 it is related to high relative humidity values. If one wants to apply at the higher end of Delta t, 8 to 10, then the droplet size needs to be larger and/or the speed reduced, and/or boom height reduced.
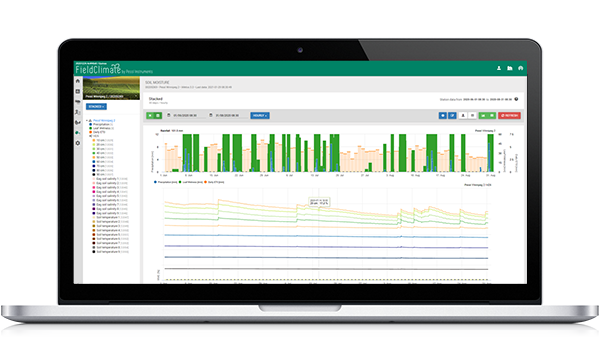
Use case - ROI - To Spray or not to Spray_picture8
Fig. 7: Delta T, relationship of temperature to relative Humidity (source: Nufarm)
Use case - ROI - To Spray or not to Spray_picture9
Fig. 8: Field specific near real-time delta T trend in relation to Air Temperature and Relative Humidity in
FieldClimate

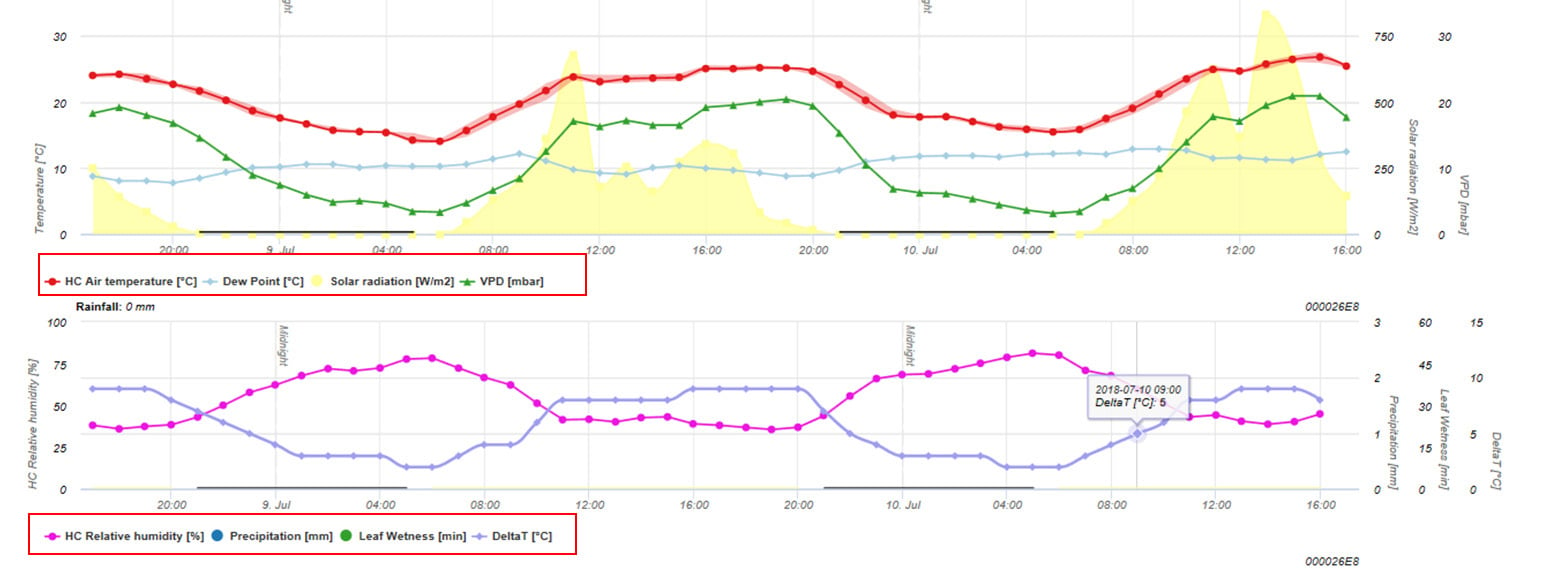
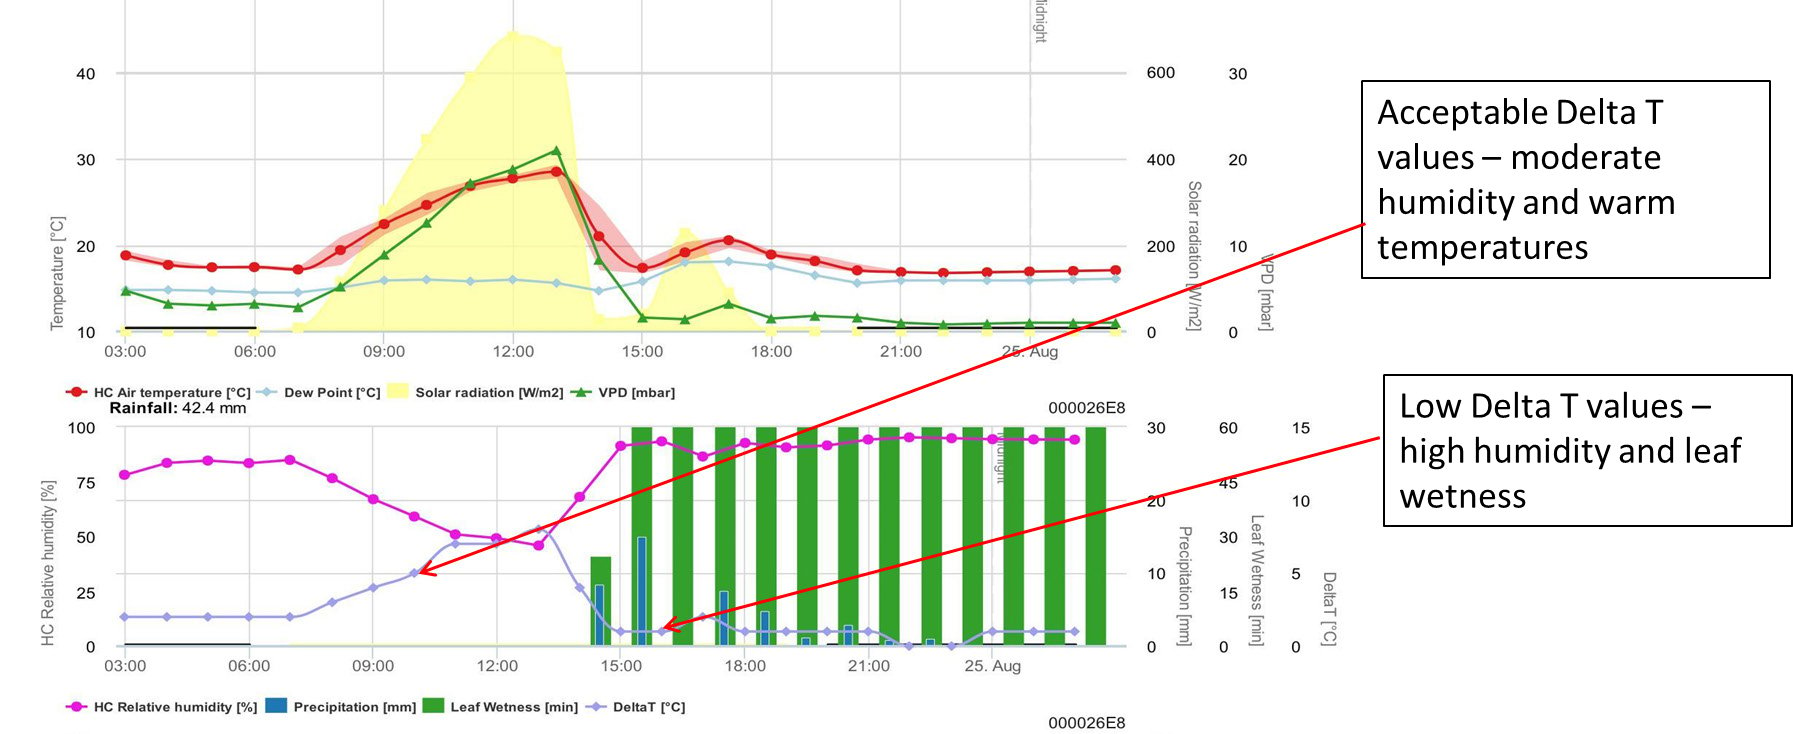
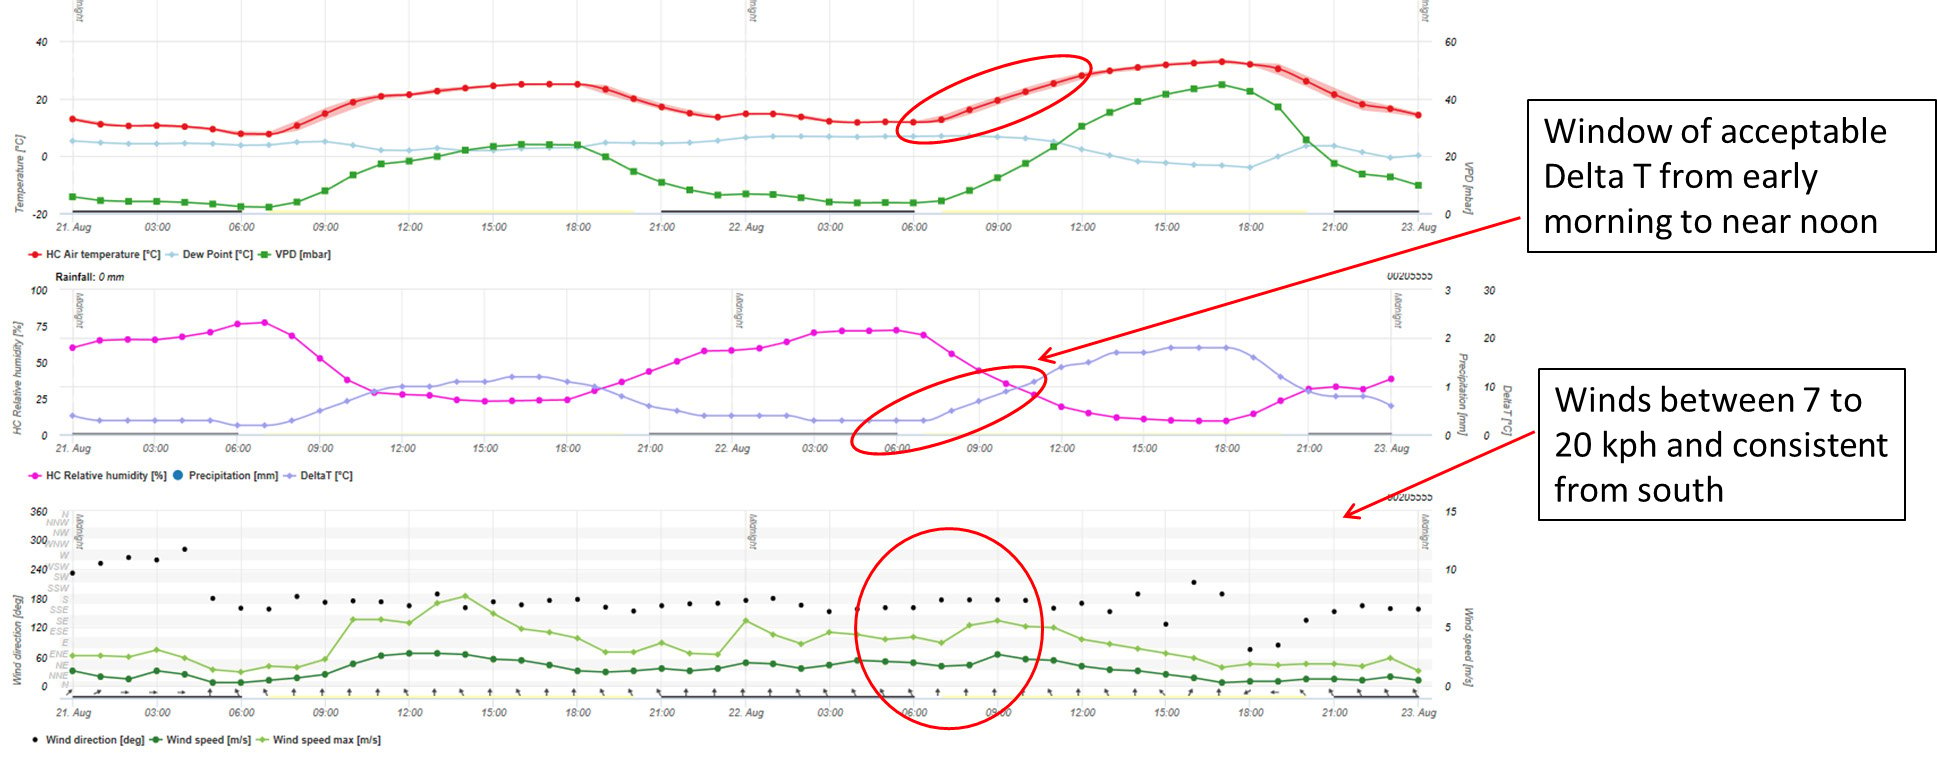
Since Delta T is an index for the survivability of a droplet based on temperature and relative humidity, it needs to be view with other important weather variables such as precipitation, leaf wetness and wind speed/direction. The graph and illustrations below are examples of acceptable and not acceptable delta T values in relation to other important weather parameters. These graphs also provide a record of past spray weather and can be used to assess spray efficacy.

Use case - ROI - To Spray or not to Spray_picture10

Use case - ROI - To Spray or not to Spray_picture11
Fig. 9 & 10: Impact of weather variables on Delta T

Temperature Inversions

Another important aspect of temperature for spraying is a temperature inversion. As the name implies, there is a reversal of temperatures from the normal, i.e., temperatures increase with height, which is inverse from the normal.
Inversion typically form in the late evening (minimal sun heating of the surface) and strengthen overnight and are strongest near sunrise. They are the result of the ground surface losing heat (long wave radiation) on clear and calm evenings and nights. If there is cloud cover and wind (turbulence) then the chances of an inversion are low.
With the ground surface losing heat, the air near the surface then supplies heat to the surface, lowering its temperature, and then creating cooler temperature near the ground. The longer the temperature inversion lasts, the stronger the inverse temperature gradient will be, which creates a dangerous situation for spraying since the spray cloud will linger like fog over the ground and may drift.

Visual cues of a surface temperature inversion

  • Mist, fog, dew, or a frost have occurred
  • Smoke hangs in the air and moves sideways, just above the surface (picture to right)
  • Cumulus clouds that have built up during the day dissipate quickly in the evening
  • Large difference between the observed maximum and overnight minimum temperatures, meaning surface cooling
  • Wind speed is constantly less than 5km/h and is variable in direction in the evening and overnight

How long will a surface temperature inversion survive?

Surface temperature inversions will likely dissipate about two hours after sunrise or if the air temperature has risen by more than 5°C above the overnight minimum and wind speed has been constantly above 7km/h for more than 45 minutes after sunrise.

Solar Radiation

The sun or solar radiation plays, and important role is proper spraying. Any plant or crop is driven by photosynthesis, which under sunny conditions is more efficient. As a result, the uptake of some herbicides has been shown to improve under sunny conditions. Other herbicides perform better under cloudy conditions since slower photosynthesis is required before the product causes tissue death. Always read the label.

Sunny conditions also increase thermal turbulence or instability, which will burn off morning inversions. However, thermal drift is an issue during unstable meteorological conditions. Pesticides can be carried aloft by rising thermal eddies and deposited some distance from the intended site. This situation is made worse under high Delta T values since the pesticides can convert to crystalline
form.

Actionable Tools

So far, we have looked at weather variables important for spraying, but these can be combined to provide a very accurate and easy-to-use toolset for decision making. The toolset creates a unique value proposition:

  • Know before you go to the field – save time and money
  • Verify field weather conditions
  • Verify forecast conditions
  • Verify site specific, real-time, and forecast Delta T values
  • Record of past spraying conditions

How does it work?

The field station provides the site-specific weather information for current spray conditions (with alerting) and is also integrated into the field specific forecast, which is further integrated into spray scheduling tools.

Use case - ROI - To Spray or not to Spray_picture12
Fig. 11: Field specific current weather conditions, precision field level hourly updated forecast for 3- or
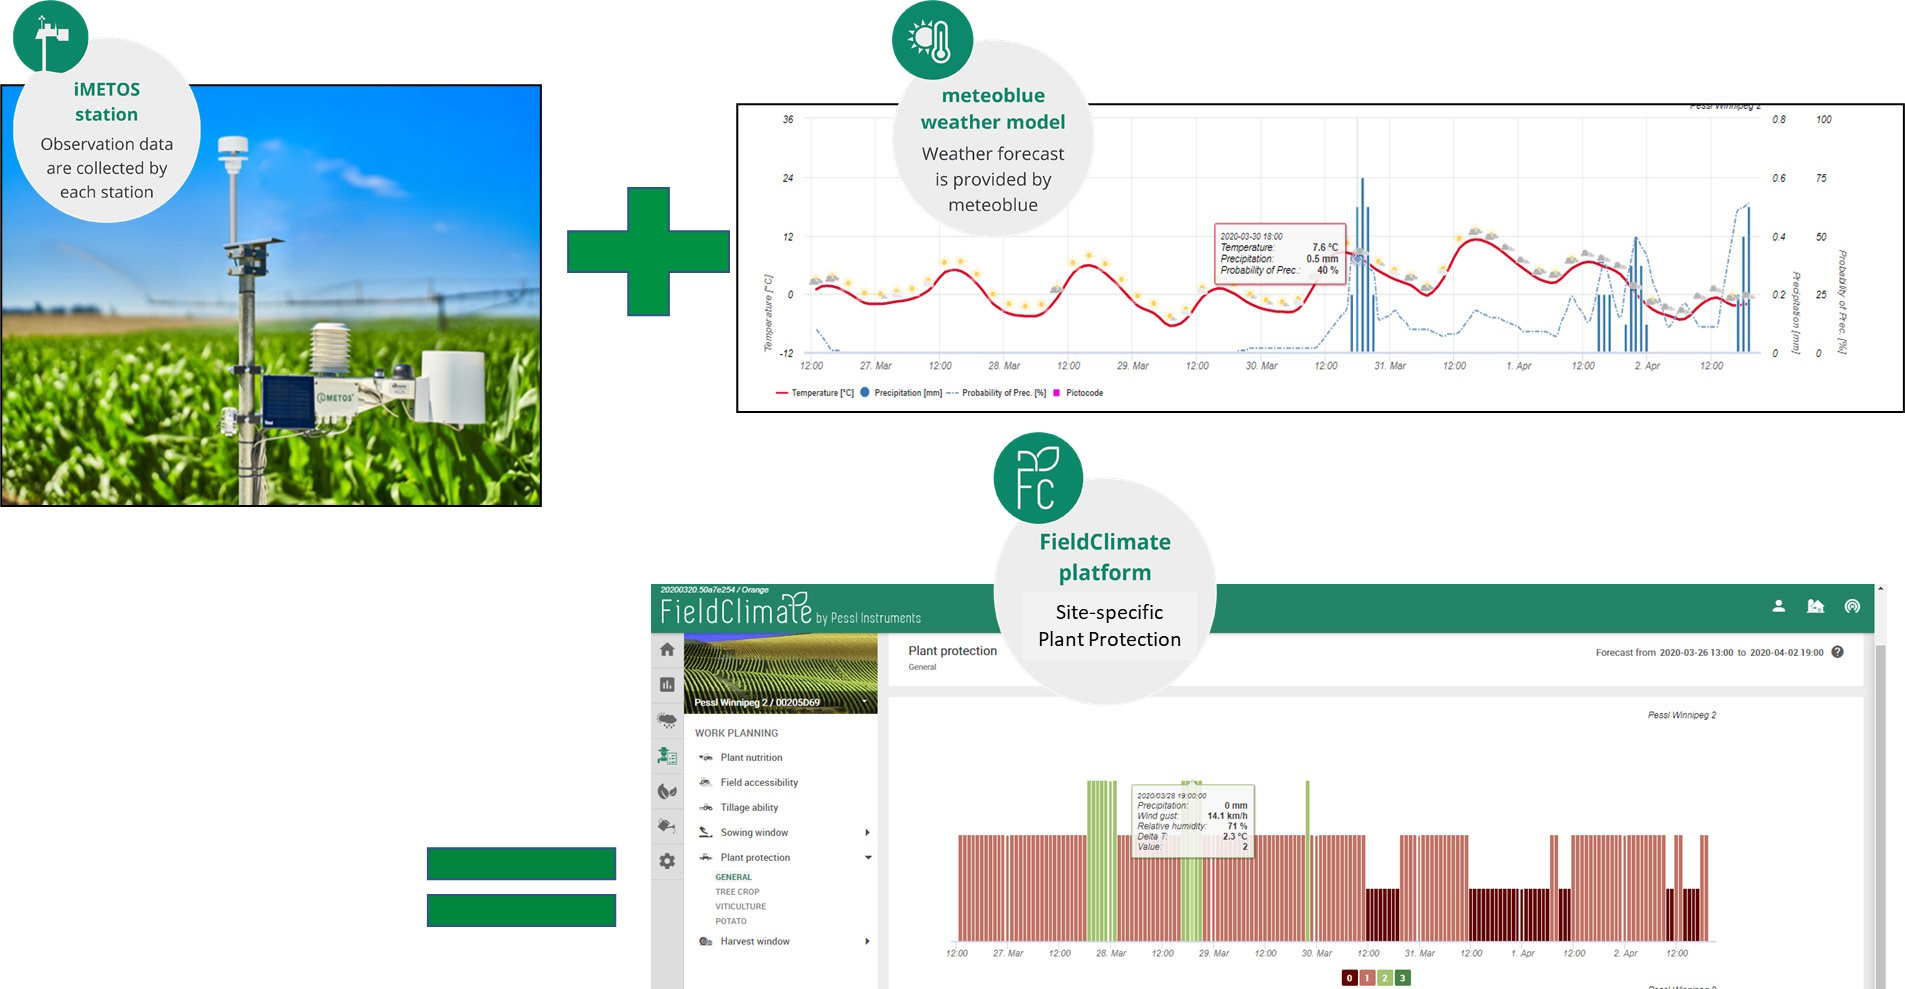
7-day period, which are then integrated into an hourly updated colour coded spray schedule for the next
7-day period

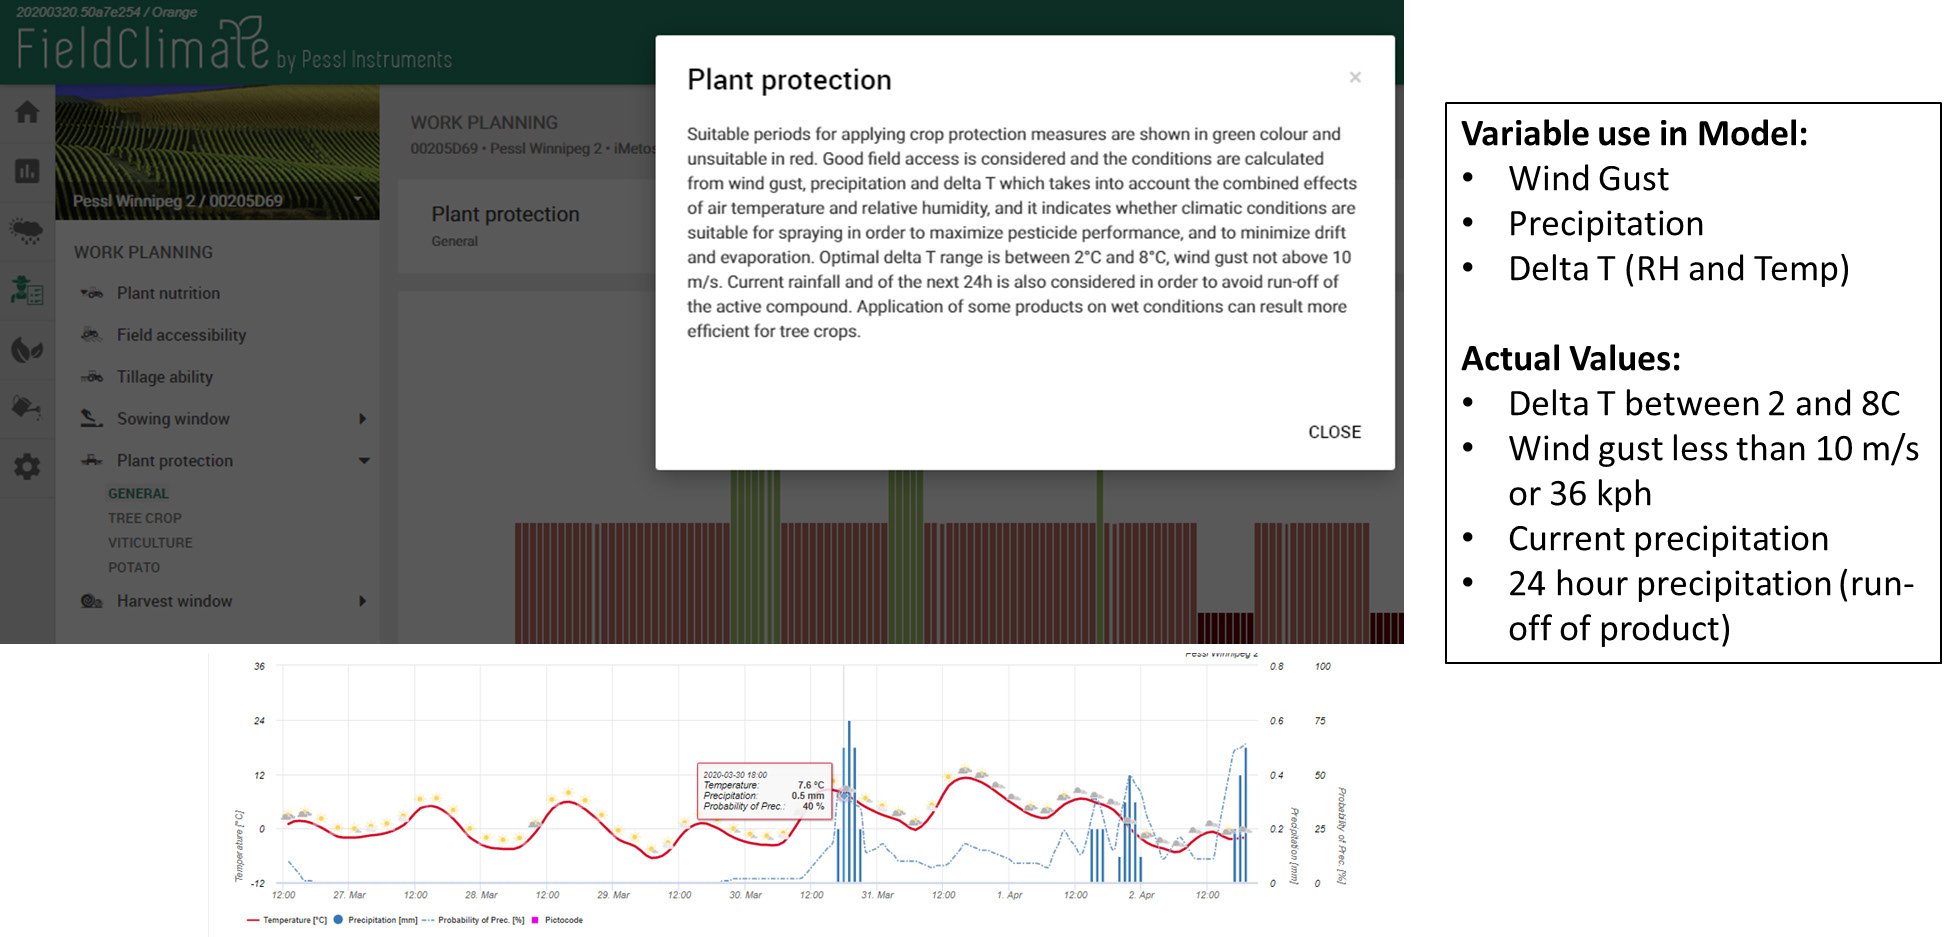
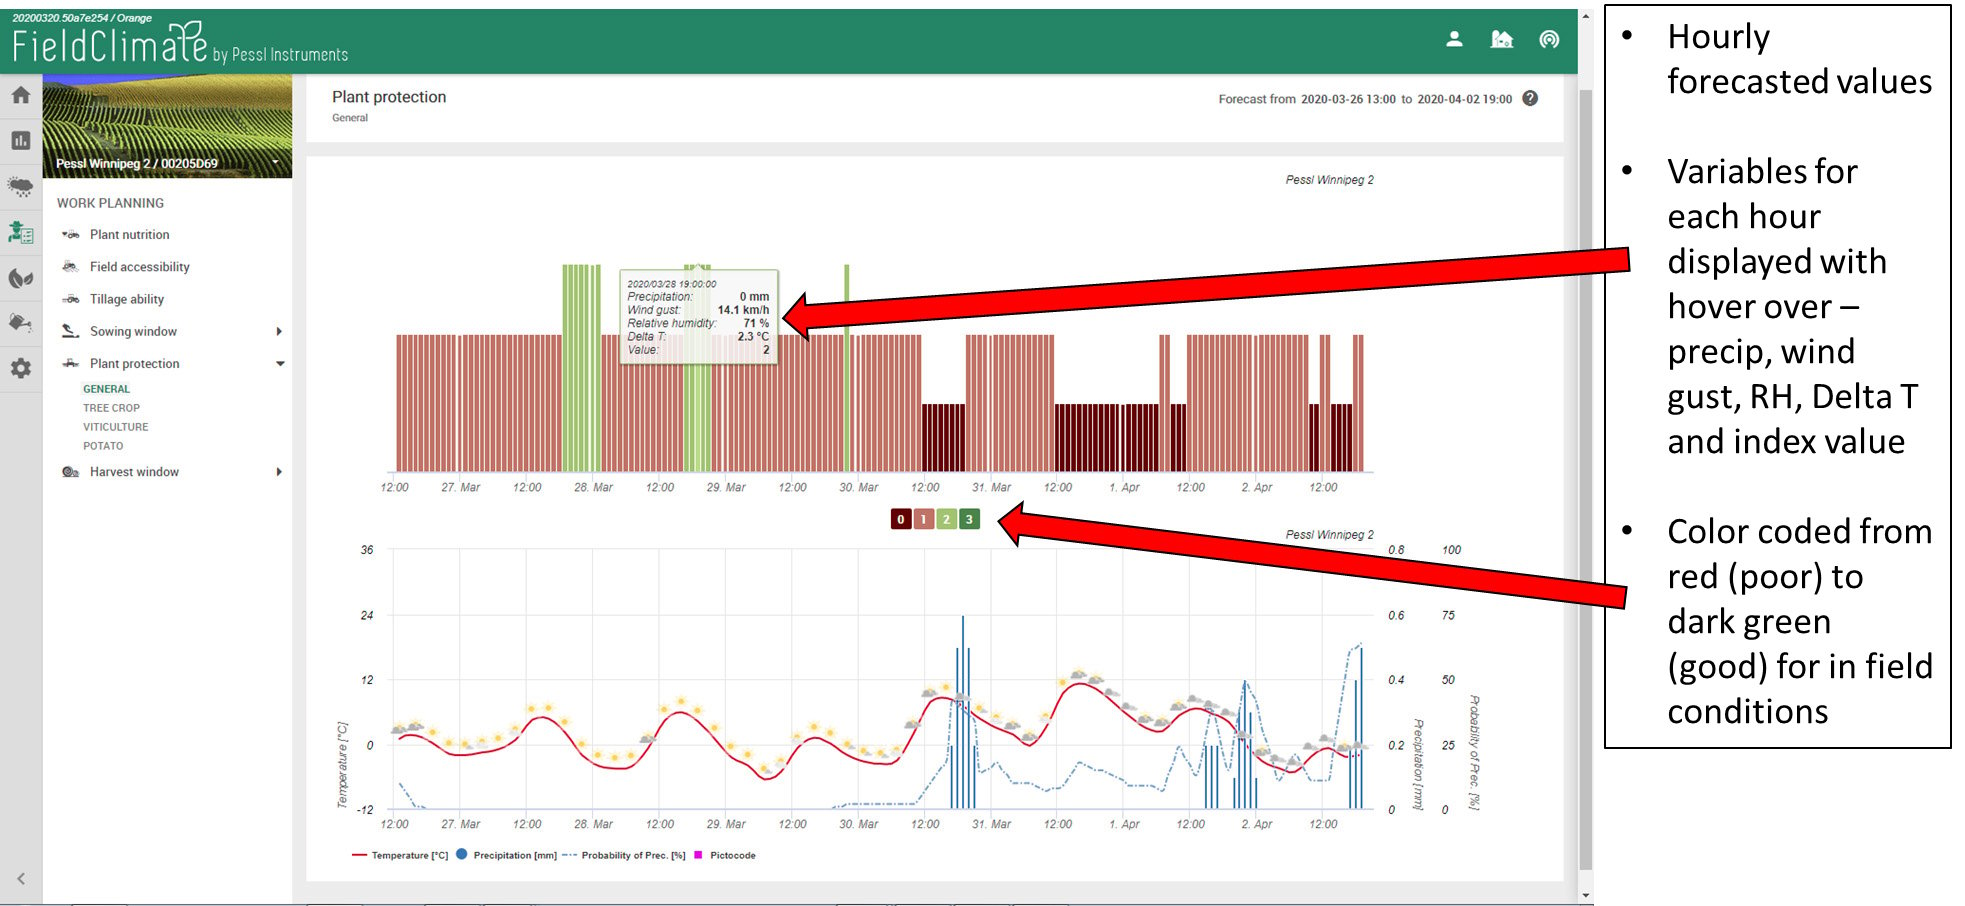
The forecasted spray schedule or plant protection model uses several criteria and there are unique forecasts for tree crops, viticulture, potato and general. In general, an hourly period is given a colour based on suitability for spraying, maroon through green. This index is based on model that use several criteria: wind gusts, precipitation (current and forecasted), delta T (relative humidity and temperature). Maroon is the worst conditions, while green is the best forecasted conditions for spraying.

Use case - ROI - To Spray or not to Spray_picture13
Fig. 12: Methodology of spray or plant protection tool in FieldClimate
Use case - ROI - To Spray or not to Spray_picture14
Fig. 13: Interpreting the results from a spray or plant protection forecast in FieldClimate

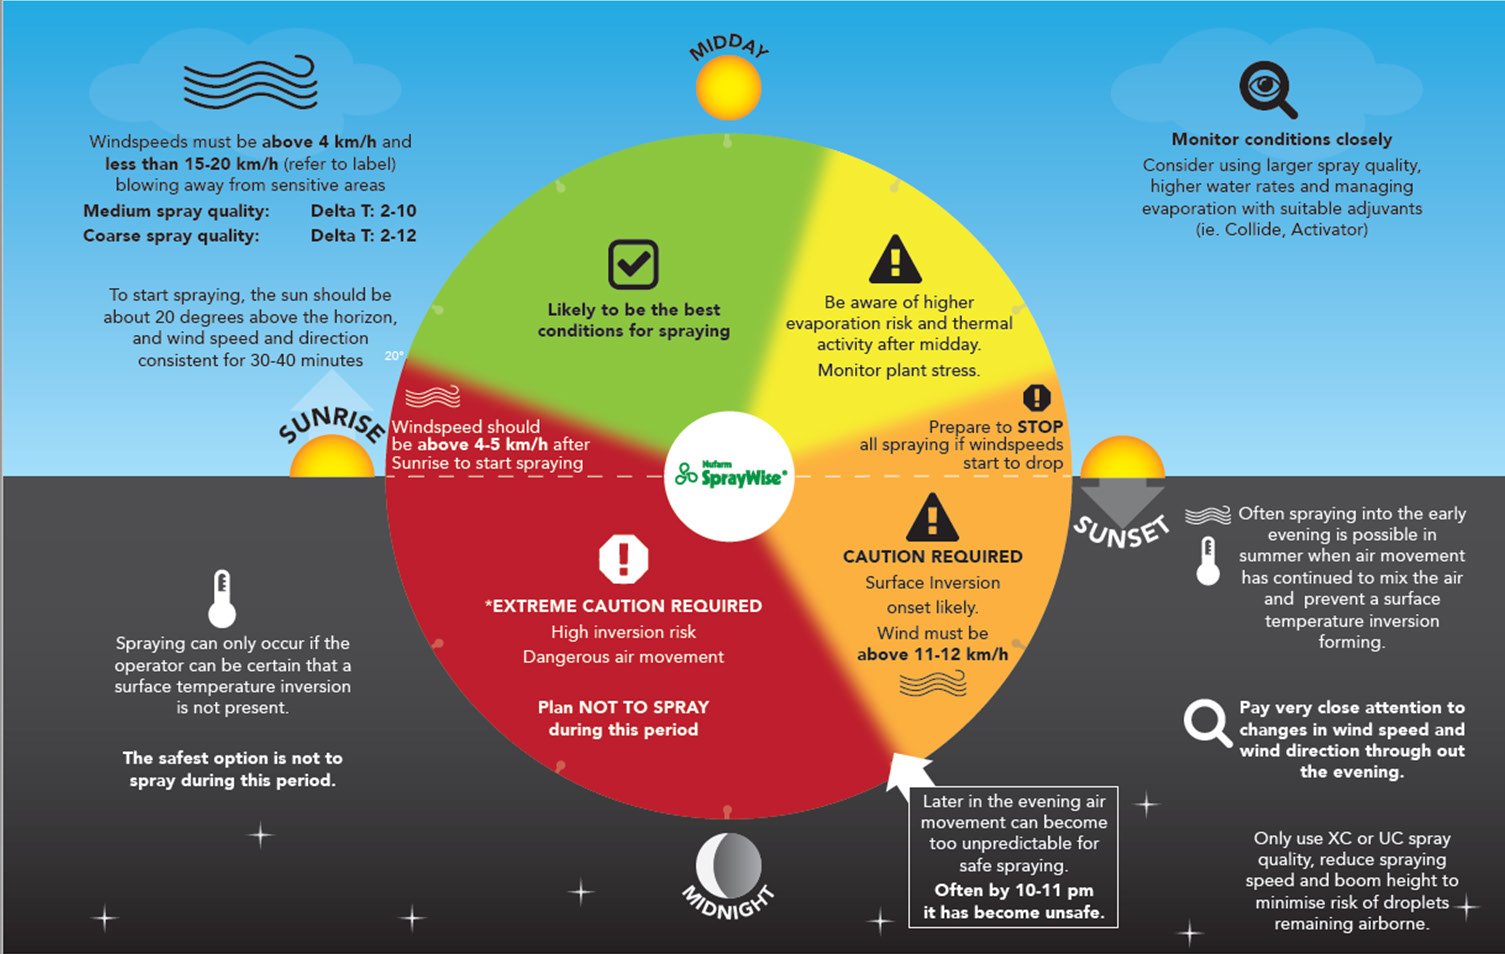
The illustration below from NuFarm does an excellent job of summarizing the daily spray or plant protection cycle.

Use case - ROI - To Spray or not to Spray_picture15

Summary and Value Proposition

Like any other science and technology, there are many improved options for having better information and tools for spray decisions. We have just highlighted some of the tools available today and as this is be written, weather devices/stations that install right on the sprayer are being evaluated for instantaneous conditions which are integrated into the sprayer’s operation. What is known, is that proper spray applications for weeds, pests and diseases can dramatically improve the quality and yield of any crop. To put in general terms, pesticide efficiency varies depending on conditions from 20 to 100%, while pesticide inefficiency can reduce quality by up to 80% & yield by up to 30%. The actionable toolset described above creates a unique value proposition for better management, improved quality and preserved yields.

  • Know before you go – save time and money
  • Verify field weather conditions
  • Verify forecast conditions
  • Verify site specific, real-time, and forecast Delta T values
  • Record of past spraying conditions

About the Author:
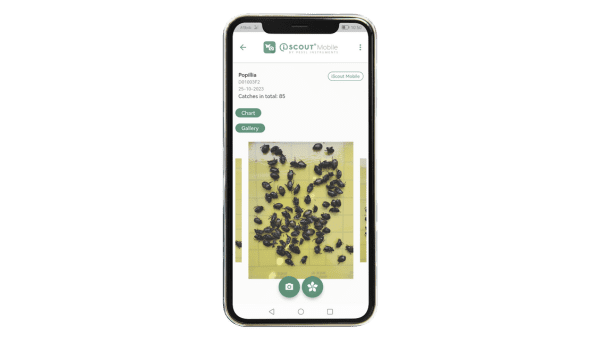
Guy Ash has worked as agro-meteorologist and earth observations science specialist for the past 30 years. Currently, he is the Global Training and Key Accounts Manager in Canada for Pessl Instruments, Austria. Pessl Instrument is an IoT company that manufactures hardware (loggers and sensors) and software solutions that are focused on the agricultural sector. We work in over 85 countries and have over 70,000 devices and 700,000 sensors deployed for a wide range of agriculture applications: disease management, irrigation, soil moisture, insect traps, crop cameras, weather stations, soil fertility, etc. One of his roles is to provide global training for an extensive list of IoT solutions for a wide variety of crops – rice, wheat, soybeans, oranges, corn, canola, forages, grapes, fruits and vegetables, etc.

Avatar-Guy

Guy Ash,
METOS® Global Training Manager