FarmView Yield Prediction and Satellite Images with In-field nMETOS or μMETOS station(s).

Timely Cropzone Yield Prediction

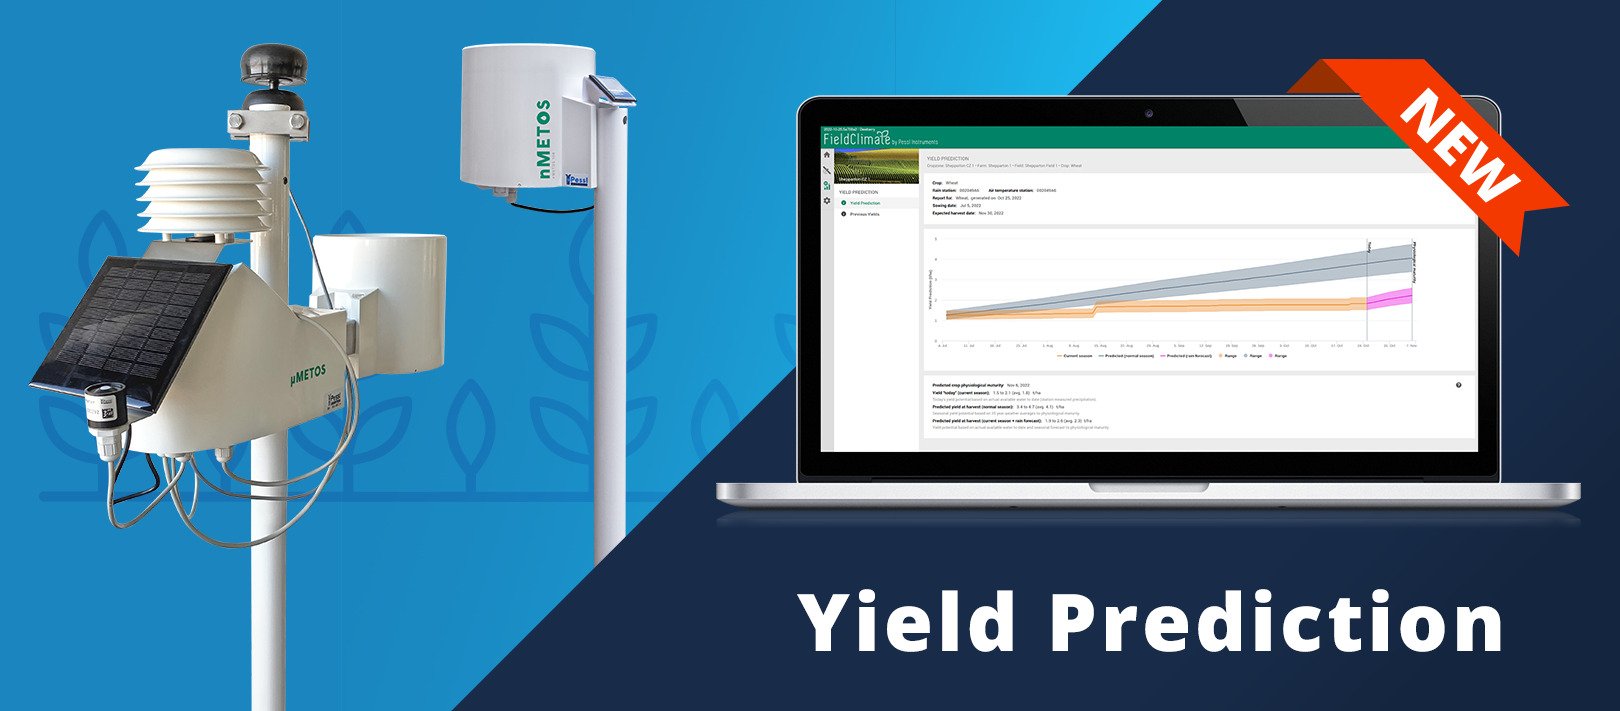
YIELD PREDICTION – AGRONOMIC ISSUE

The yield of any crop is based on the genetic potential of the seed, the amount of spring soil moisture, growing season precipitation (and irrigation), proper fertility rates and other management decisions.

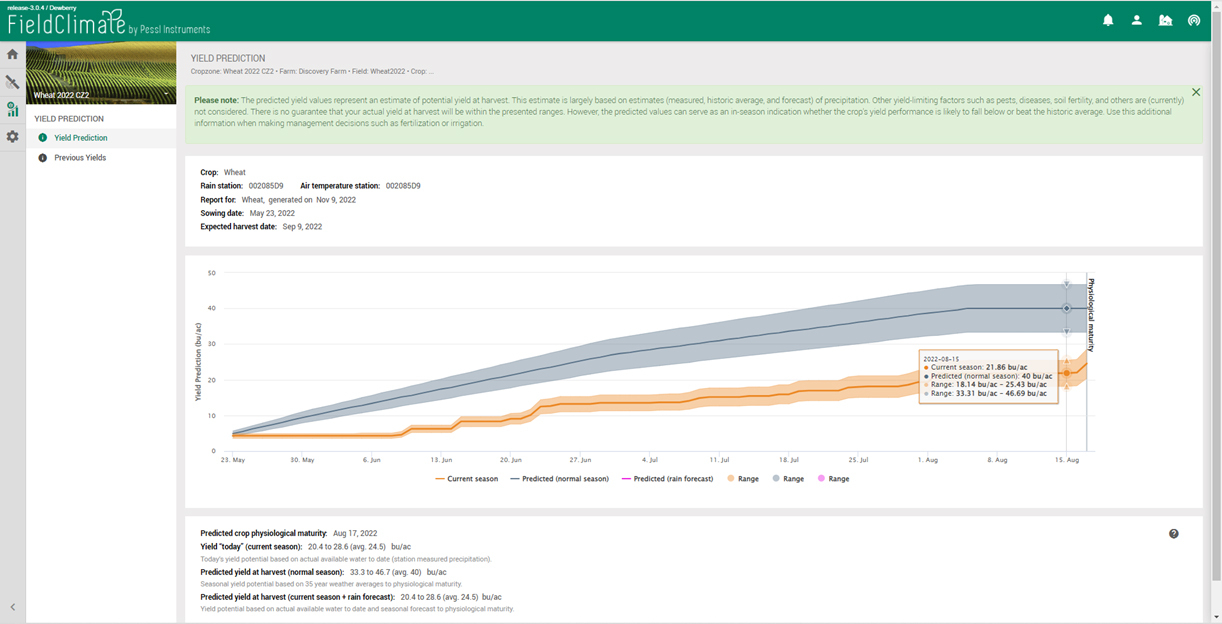
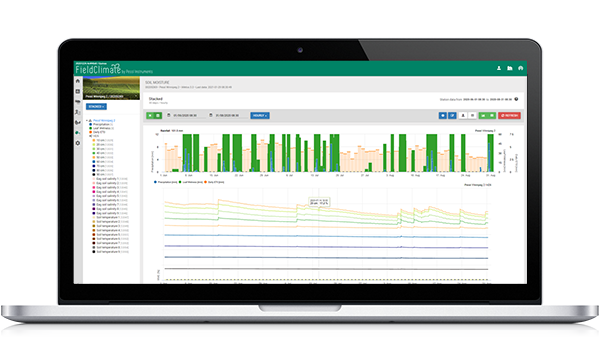
Generally speaking, the two most factors for yield are moisture supply and temperature, given that all other field management decisions are carried out properly. Temperature or heat is important, since it determines whether a crop will mature or suffer heat stress, but the moisture supply has the most significant impact on yield potential. This is why moisture supply is often referred to as the CROPS GAS TANK for yield potential.

Each inch of soil moisture or water used by the crop roughly equates to 5.5 bu of canola,7.5 bu of wheat and 10 to 12 bu of corn yield, for example. Each crop has water use efficiency curves related to yield. Therefore, the total amount of soil water available to a crop during the growing season is equal to the amount of soil moisture available at seeding time (determined by soil type) plus the amount of precipitation and/or irrigation (soil moisture) received over the growing season. This defines the yield potential.

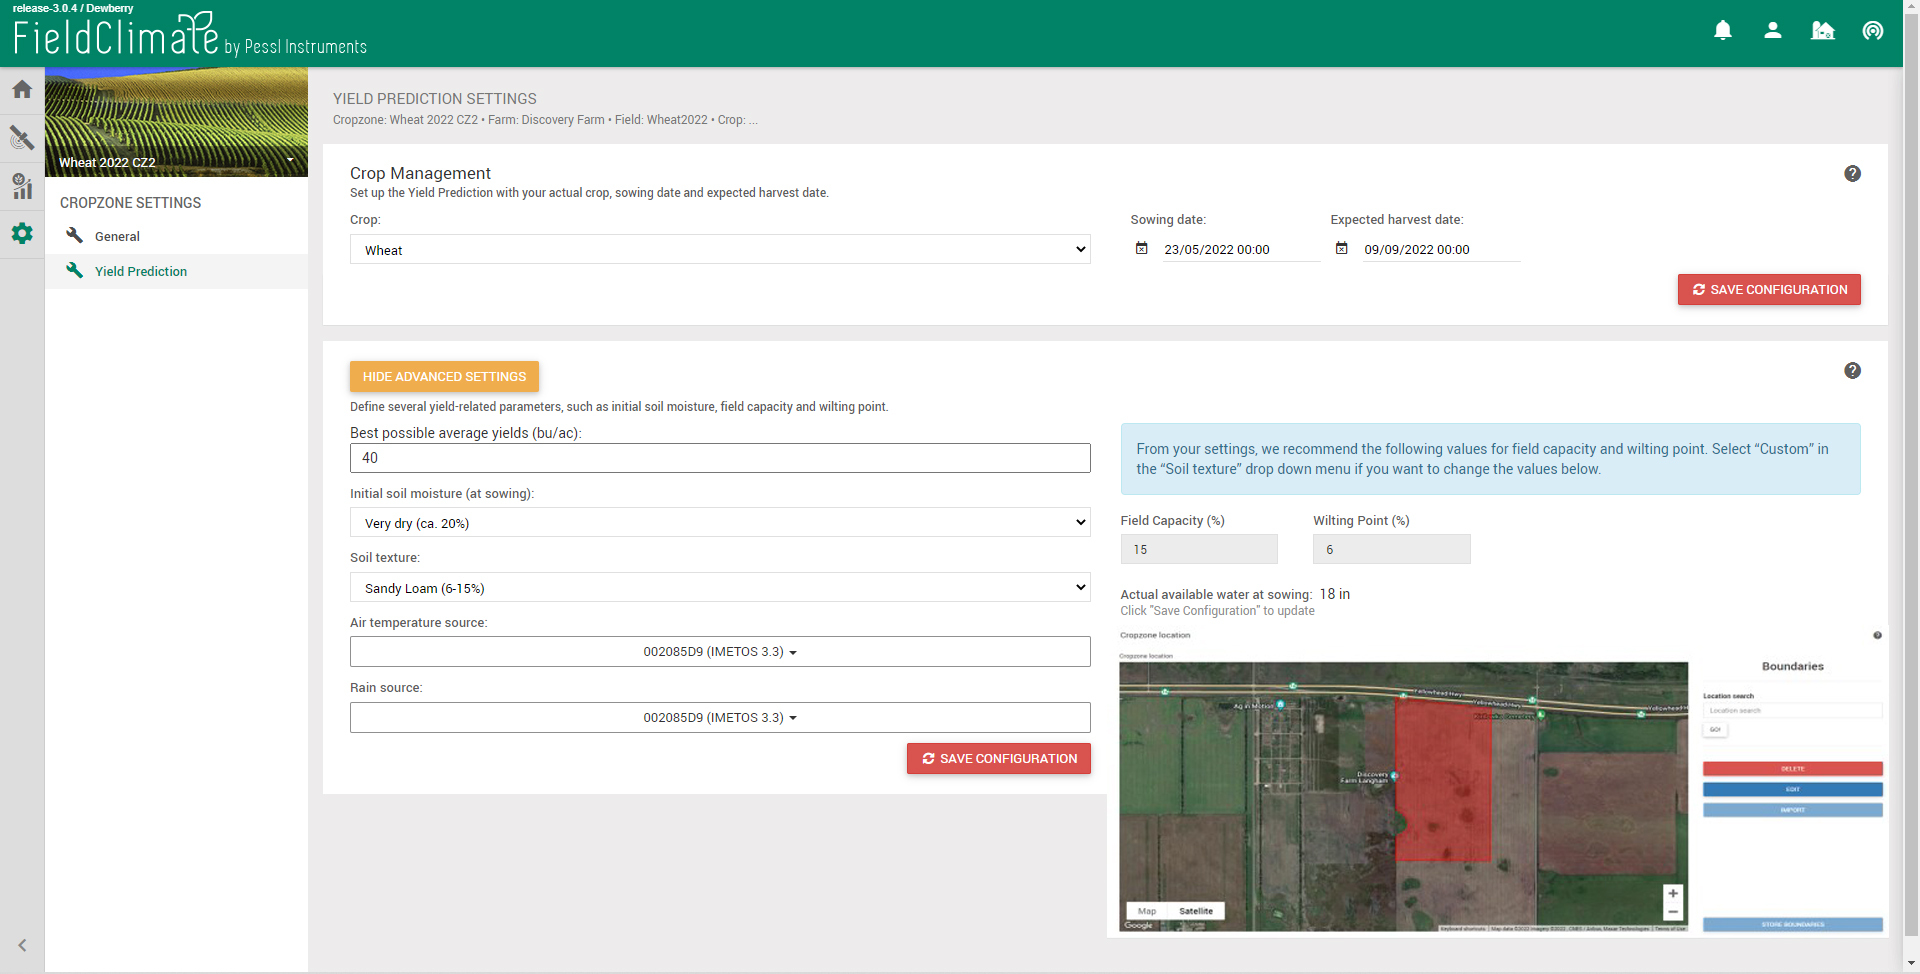
Based on predictive cropzone yield information, a farmer can adjust important management decisions during the growing season regarding pesticide use and fertilizer application. Improve 4R management: right rate and time, with yield prediction.

yield prediction_cover

IoT SOLUTION
FarmView Yield Prediction and Satellite Images with In-field nMETOS or μMETOS station(s)

Setup cropzones: crop type, seeding date, soil type, highest field average yield potential and choose weather device.

Each inch of water in the soil translate into x bu of yield (given that all other agronomic management issues are taken into account).

Examples:
• Canola: 5 to 6 bu for each inch of water in the soil
• Wheat: 7 to 8 bu for each inch of water in the soil
• Corn: 10 to 12 bu for each inch of water in the soil

Yield prediction - setup cropzones

Graph yield prediction: view the average and range in yield to date, view the long term normal average or the seasonal adjusted forecast average of yield to date and physiological maturity.

Yield prediction graph

View satellite images: view individual images for each date, either LAI or NDVI and see field variability. Graph crop vigor to determine stages of development.

Cost Benefits: CropZone Yield Prediction: A Yield Maker or Money Saver

Three case examples for wheat:

  • The grower purchased yield prediction and weather solution and decided the season was too dry for in-season nitrogen based on cropzone yield prediction to date and maturity (good decision based on weather information). Saved $23,000 in nitrogen costs (plus application costs) and returned about $615,000 (41 bu*$10*1500) on 1,500 acres.
  • The grower didn’t purchase yield prediction and weather solution and went on gut feeling and added extra nitrogen late season and didn’t have enough rainfall and root zone soil moisture (poor decision which was mostly yield limiting). Extra $23,000 in nitrogen costs (plus application costs) and returned about $600,000 (40 bu*$10*1500) on 1,500 acres.
  • The grower purchased yield prediction and weather solution and the season was favorable based on cropzone yield prediction and rainfall data and so decided to apply mid season nitrogen (yield in-creased markedly). Extra $23,000 in nitrogen costs (plus application costs), but returned about $765,000 (51 bu*$10*1500) on 1,500 acres.

IoT Solution Cost: $2,500
ROI: 9.0 to 50.0 to 1

Voice of the Grower

“The predicted 18 –25 bu/ac range and 21.8 bu/ac average for our field aligns quite closely with the actual average yields (20 bu/ac) we harvested. This was confirmed from combine yield data.”

“The actual yield on our farm was low as a result of too wet conditions at seeding, perhaps a bit later seeding and lower fertilizer application rate. Knowing the agronomics applied on this crop, the tools is very useful in making future adjustments, especially for things that a farmer can control, such as fertilizer rates, seeding date, seeding rates, depth and pest control.”

“Field average yield for 2022 was: 94.5 bu/acre. Yield prediction was 96 bu/acre with a range of 80 to 112 bu for the field.”