
What is it, how much is stored, how is it measured, and how much is lost each day?
Soil Moisture Monitoring:
The Gas Tank for Crop Development
What is it, and how much is stored?
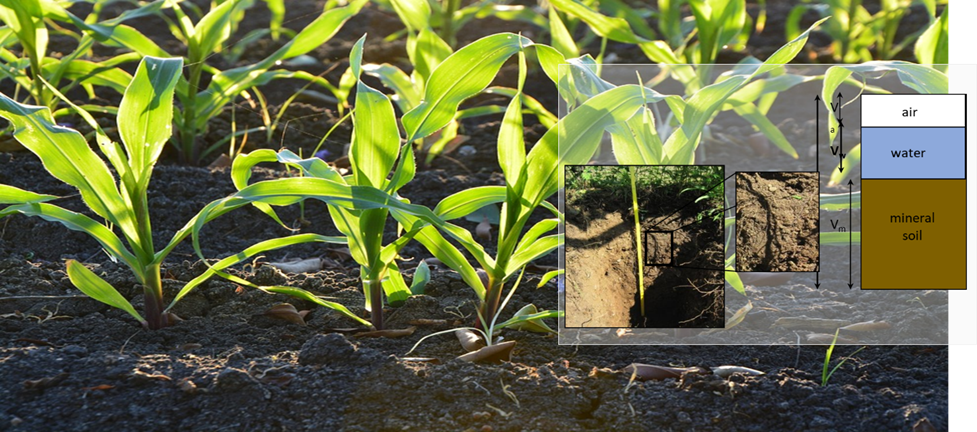
First off, the concept of available crop/plant soil moisture should be discussed in terms of the rooting zone since this is where the plant/crop is withdrawing its moisture/nutrients from.
As expected, the depth of the root zone will vary based on the type of crop (perennial or annual) and the type of soil.
Perennial crops will have well established roots once they are mature, while annual crops develop their roots through the growing season. What is important is that the plant/crop is using water from the rooting zone and as an annual crop grows, the roots reach deeper into the soil, i.e., a larger gas tank.
The type of soil can affect rooting depth but also has a significant impact on the amount of stored water. Sandy soils have a small gas tank for stored water, while clay soils have a larger tank (Fig 1 & 2). What is important is that root zone soil moisture is the CROP’S GAS TANK for all biological processes, so it needs to be monitored, measured, and managed.

- Plants can’t use all the water held in the soil. The upper limit is Field Capacity, while the lower limit is the Permanent Wilting Point.
- Field Capacity – is the maximum amount of water held in the soil, measured a couple of days after a saturation event.
- Permanent Wilting Point – If a plant can no longer withdraw water from the soil to meet its needs, then it will begin to wilt; that is the point at which water is no longer available to the plant.
- Plant-Available Water is the difference between Field Capacity and Wilting Point where the plant can no longer extract water from the soil. In other words, not all the water held in the soil is available to plants.
- Therefore, an Allowable Depletion level is used based on soil type and crop.
- The crop and root zone depth, together with soil texture and structure, determine the readily available water available for plant growth.
Therefore the key point is that Plant-Available Water is the soil moisture that is used before a moisture deficit starts to affect crop/plant growth.
For many crops, the top half (50%) of the plant’s available water range is available without causing stress to the crop. In horticultural crops, it’s usually the top third (33%) or quarter (25%) that is available before moisture stress occurs.
In summary, crops will start to suffer from a lack of water once 50% to 25% of the available moisture is used up or long before the wilting point is reached.

Numerous studies in Canada and other countries have clearly demonstrated that knowing root zone soil moisture through field and site-specific monitoring or measurement can maximize yields and, in some cases, lower input costs. In other words, each inch or 25mm of soil water equates to so many bushels of yield for a crop, given that disease, insects, weeds, and nutrients are managed correctly. In wheat this is roughly 7 -8 bushels, for corn 10 – 12 bushels, and canola 5 – 6 bushels for each inch or 25mm of stored soil water.
How is soil moisture measured?
The determination of soil moisture is accomplished through two common methods: Measured and Water-Balance approach.
Measured involves placing a sensor(s) in the rooting area of a plant/crop and measuring the soil moisture at each sensor location.
A water-balance approach involves making water demand estimates via an equation for evapotranspiration (ET0) and tracking the input of precipitation and/or irrigation.
1. Measured Soil Moisture
- Today, many kinds of soil moisture sensors are available for measuring soil moisture in near real-time.
- These are generally volumetric or tensiometric sensors.
- Tensiometric sensors measure soil moisture in terms of centibars or kilopascals which represents how much suction the roots feel in removing water and nutrients.
- Volumetric sensors measure the volume of soil moisture in a unit of depth and can be expressed in mm or inches of water or percent capacity per unit depth of the soil.

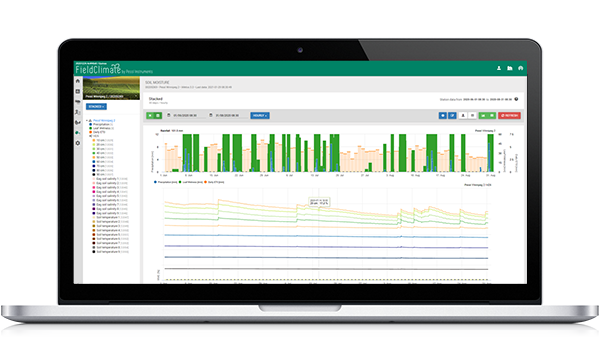
The image below illustrates a 90 cm (3-foot) probe with sensors every 10 cm (4 inches) for soil moisture for a total of 9 sensors. From April 26 through April 30 rain occurred, and the sensors instantly illustrated how much rain was absorbed in each layer and how far the rain infiltrated into the soil.

The image below further illustrates the capability of a well-placed weather station and soil moisture probe in the root zone of a crop. Here you can see recharge events: at what depth the plant roots are using water from, referred to as stair stepping on the image, when the roots can no longer withdraw soil-water, referred to as no stair stepping, and how the roots become active when a layer is recharged with rainfall.

2. Water-balance Soil Moisture
- The traditional way has been to use a water balance or checkbook method. This involves using an ET0 equation, crop coefficients, and soil types to daily estimate how much water the crop is using based on the root zone and crop stage.
- This is accomplished by having a local weather station that measures the necessary parameters for the ET0 calculations.
- Typical measured parameters are temperature, relative humidity, solar radiation, precipitation, wind speed, and gust.
- The crop and soil are also parameterized: soil type, field capacity, wilting point, crop type, seeding date, ground cover, and rooting depth.
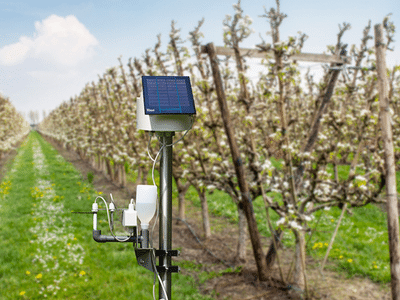
The image below shows an in-field weather station that is measuring air temperature, relative humidity, solar radiation, wind speed/direction and precipitation. These sensor readings are used in an equation by the FAO (Penman Monteith FAO Method) for the calculation of ET0 or evapotranspiration. This equation is used in Irrimet to produce a water balance for a cropzone.

Another way to look at ET0 or evapotranspiration, is via the illustration below. Potential evapotranspiration is the maximum amount of water that is used in an hour or day. This occurs with no restrictions on soil moisture, crops fully covering the ground, and the daily weather conditions.
Actual evapotranspiration is usually less than potential evapotranspiration since there are restrictions on soil moisture and ground cover with annual crops since they need to reach full ground cover. In years when you have high soil moisture, significant leaf area coverage (a thick stand), and warm temperatures, the actual ET0 will be the same as the potential ET0.

How much soil water is lost in a day?
The next graphic attempts to illustrate how a corn crop develops in terms of the canopy and roots and how much water is being used daily through the growth cycle. What is shown is that early in development, with little ground cover, the water use per day is 1 to 2 mm, but by the time full canopy and reproduction take place, the daily water use can range from 5 to 9 mm, or 0.2 to 0.35 inches on a warm day. In a week, this is 35-63 mm or 1.35-2.5 inches. The corn crop must meet the water requirement from either stored soil moisture and/or rain-irrigation. If the daily or weekly amount is not met, then growth and nutrient updates are reduced, which can lead to yield losses and quality issues.

Measured or Water-balance soil moisture values in FieldClimate and FarmView cropzones
Both measured and modelled soil moisture can be displayed in FieldClimate and/or FarmView.
1. FieldClimate soil moisture probe monitoring
In FieldClimate you can view soil moisture from each sensor on a probe in several different ways.
You can view the soil moisture from the bottom up, top down, or by averaging or summing the values for a set of sensors along the probe. You can also select any custom view that you have saved as well.
1. FarmView-Cropzone soil moisture monitoring
In order to use FarmView, you will need a subscription for Irrimet and Soil Moisture. The first step is to define a cropzone, which can be done by manually drawing the zone or importing a geojson boundary file. Cropzones are distinct management zones within each field that are defined based on differences in soil types, elevation, and slope.
Want to learn more?
Download the brochure with much more detailed information and even greater amount of pictures.
