

1. INTRODUCTION
WHAT IS VAPOUR PRESSURE DEFICIT?
If you have a METOS® device with hygroclip sensor (air temperature and relative humidity) now you can also see Vapour pressure deficit values and chart in FieldClimate. Vapour pressure deficit (VPD) is a value calculated from relative humidity and air temperature and is in a close relationship to evapotranspiration.
VPD is an indication that takes into account the effect of temperatures on the water-holding capacity of the air, which is what drives transpiration of the leaf surface (transpiration occurs when water pressure in leaves is higher than air vapour pressure).
It is the difference between the amount of moisture in the air and how much moisture the air can hold when it‘s saturated (100 % RH). When the air is saturated (vapour starts to condensate) the clouds will form, dew will form, and leaf wetness will appear.
If we have low VPD, this means that RH is high and transpiration is low, we also have leaf wetness.
If we have high VPD, this means that RH is low, no leaf wetness, and plants need to draw more water with its roots – high transpiration.
 Table 1: Vapour pressure (mBar) at various air temperatures (°C) and relative humidities (%).
WHAT IS NEEDED FOR CALCULATION?
• Air temperature (from HC)
• Relative humidity (from HC)
We can then calculate the saturation pressure. Saturation pressure can be looked up in a psychrometric chart or derived from the Arrhenius equation, a way to compute it directly from temperature is:
Figure 1: Psychrometric chart
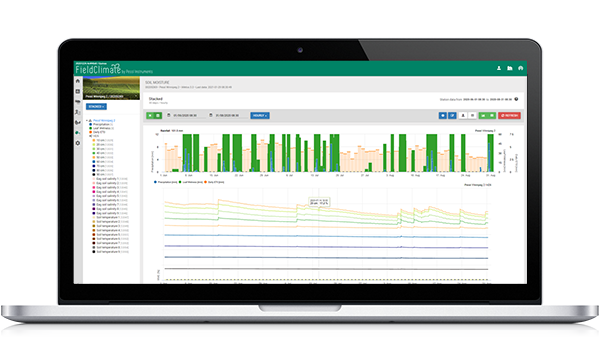
HOW IS IT SHOWN IN FieldClimate?
Figure 2: VPD Chart on FieldClimate showing vapour pressure deficit (mBar), air temperature (°C) and relative humidity (%).
2.2 TOO LOW VPD (humidity too high)
Table 1: Vapour pressure (mBar) at various air temperatures (°C) and relative humidities (%).
WHAT IS NEEDED FOR CALCULATION?
• Air temperature (from HC)
• Relative humidity (from HC)
We can then calculate the saturation pressure. Saturation pressure can be looked up in a psychrometric chart or derived from the Arrhenius equation, a way to compute it directly from temperature is:
Figure 1: Psychrometric chart
HOW IS IT SHOWN IN FieldClimate?
Figure 2: VPD Chart on FieldClimate showing vapour pressure deficit (mBar), air temperature (°C) and relative humidity (%).
2.2 TOO LOW VPD (humidity too high)
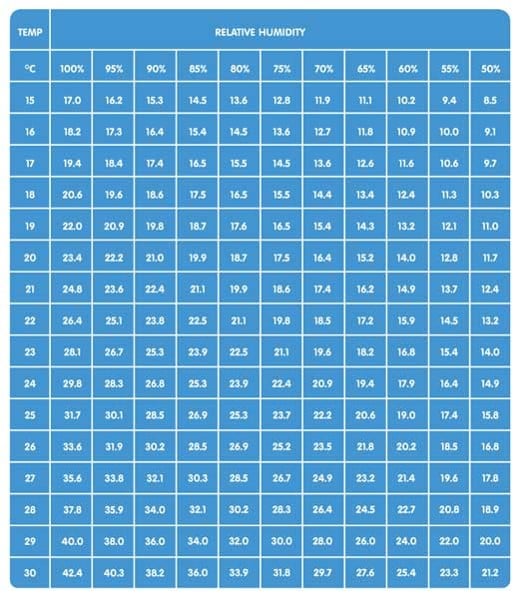 Table 1: Vapour pressure (mBar) at various air temperatures (°C) and relative humidities (%).
WHAT IS NEEDED FOR CALCULATION?
• Air temperature (from HC)
• Relative humidity (from HC)
We can then calculate the saturation pressure. Saturation pressure can be looked up in a psychrometric chart or derived from the Arrhenius equation, a way to compute it directly from temperature is:
Table 1: Vapour pressure (mBar) at various air temperatures (°C) and relative humidities (%).
WHAT IS NEEDED FOR CALCULATION?
• Air temperature (from HC)
• Relative humidity (from HC)
We can then calculate the saturation pressure. Saturation pressure can be looked up in a psychrometric chart or derived from the Arrhenius equation, a way to compute it directly from temperature is:
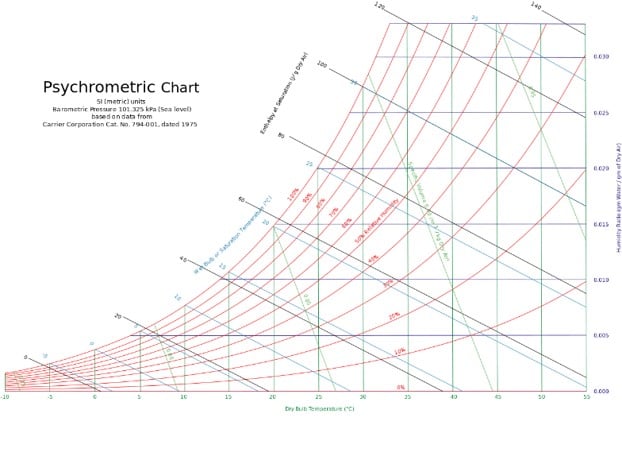 Figure 1: Psychrometric chart
HOW IS IT SHOWN IN FieldClimate?
Figure 1: Psychrometric chart
HOW IS IT SHOWN IN FieldClimate?
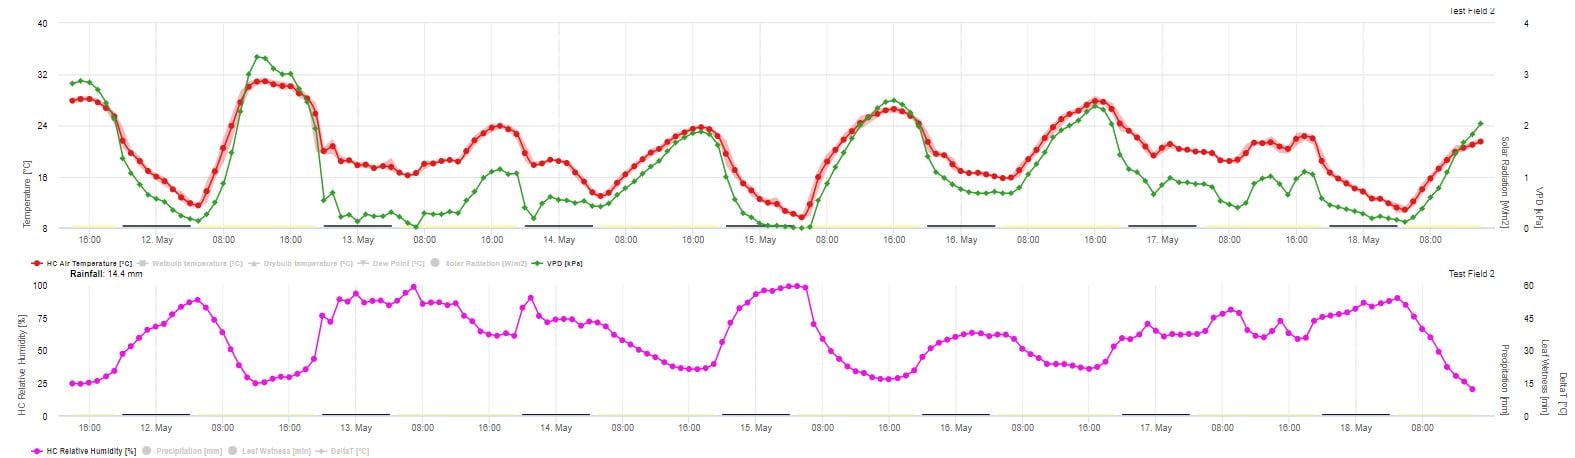 Figure 2: VPD Chart on FieldClimate showing vapour pressure deficit (mBar), air temperature (°C) and relative humidity (%).
2. USE CASES
2.1 TOO HIGH VPD (humidity too low) Rate of evapotranspiration from the leaves can exceed the supply of water through the roots – the stomata will close and photosyntesis will slow down or stop. Leaves are at risk of high temperature injury, since evaporative cooling is reduced. To avoid injury and death from wilting, many plant species will either curl their leaves or orient them downwards in attempt to expose less surface area to the sun. This can downgrade the quality of potted and foliage plants and can also reduce the growth rate and quality of vegetable crops.
 2.2 TOO LOW VPD (humidity too high)
- Plants are unable to evaporate enough water to enable the transport of minerals (calcium) to growing plant cells, even that the stomata may be fully open.
- At extremly low VPD water may condens onto leaves, fruits and other plant parts. This can provide a medium for fungal growth and disease.
- At low VPD also gutation can occur (plant exude water from their leaf cells).
- When plants are unable to evaporate water, excessive turgor pressure within cells can cause splitting and cracking of fruits (for example tomato).
- In cases where VPD alternates between too high and too low, fruit quality can be adversely affected by shrink cracks in the skin of the fruit, as turgor pressure alternately expands and contracts the water-filled cells in the fruit.
- More healthy plants, because of lower diseases pressure (low RH).
- More nutrients uptake, because of more root system activity (high transpiration), also more water uptake.
- If we keep high VPD at lower temperature (higher RH), we will avoid transpiration stress.
1.OVERVIEW
WHAT IS DELTA T?
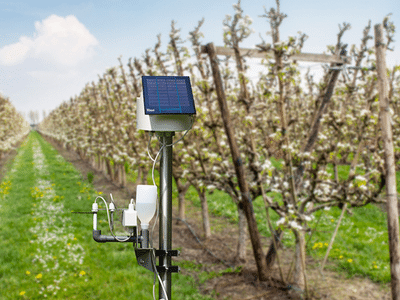
- Delta T calculation requires an hygroclip sensor (Air Temperature and Relative Humidity) installed on the METOS® station: data can be viewed on FieldClimate in charts and tables with a detailed resolution.
- It is a measure that takes into account the combined effects of temperature and humidity and it indicates whether climatic conditions are suitable for spraying in order to maximize pesticide performance (A. MacGregor, 2010).
- The optimal Delta T range is between 2°C and 8°C.
- Although applicable all year round it is especially used in summer as higher temperatures and low relative humidity limit spraying time.
- Keep monitoring Delta T reading and set up an efficient spray on schedule. Weather conditions can change rapidly during the day, so having the ability to monitor delta T can help to improve pesticide performance.
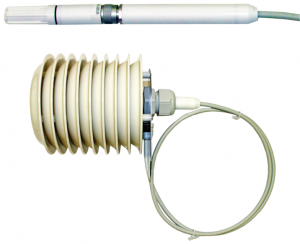
Figure 1: Air Temperature and Relative Humidity Hygroclip sensor
2. DELTA T CALCULATIONS
Sensors needed:
- Air Temperature (from hygroclip)
- Relative Humidity (from hygroclip)
Delta T is calculated by subtracting the wet bulb temperature from the dry bulb temperature.
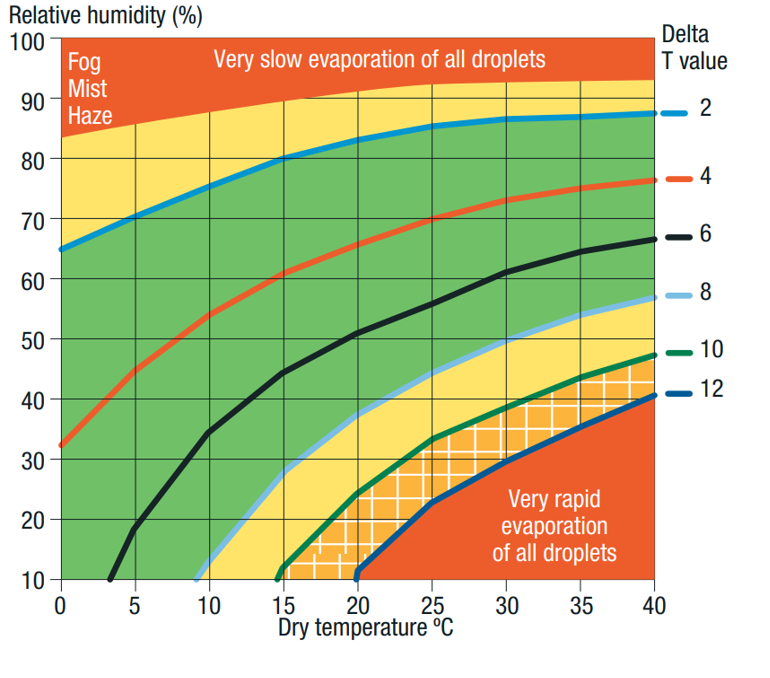
Figure 2: The relationship of Delta T to temperature and relative humidity. A common spray guideline is to spray when Delta T is between 2 and 8, with caution below 2 or above 10 (yellow areas). A Delta T value above 8°C is associated with higher temperatures and lower humidity, if lower than 2°C it is related to high relative humidity values. Source: Adapted by Gramae Tepper (2012) originally sourced from Nufarm’s sprays decisions chart.
3. DELTA T IN FIELDCLIMATE
Delta T is integrated in the Spraying Climate Window. It is available as a 7-day accurate forecast, calculated on an hourly basis and calibrated with on-side data from your METOS® station.
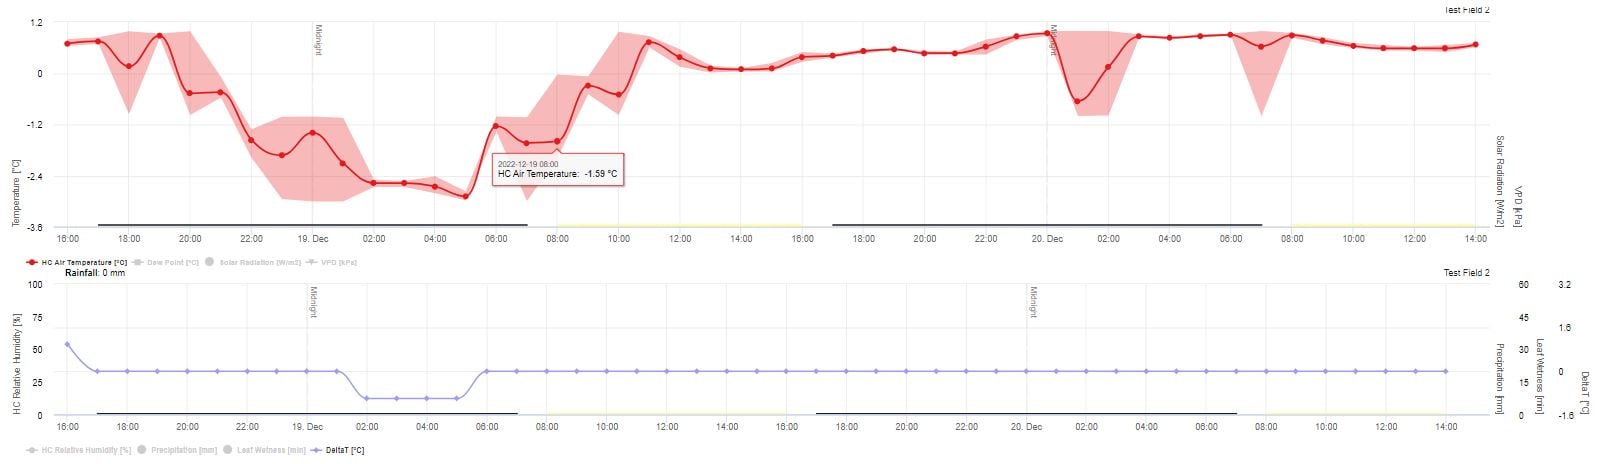
Figure 3: Delta T trend in relation to Air Temperature and Relative Humidity in FieldClimate.
4. HOW TO USE IT
On-site weather condition readings are required before each spray, in particular a live reading of Delta T is always recommended.
- Set a minimum or maximum threshold for SMS warning. Delta T live reading is updated every 5 minutes.
- For a more effective spray application combine Delta T with more weather parameters, e.g. wind speed and direction: avoid either variable or gusty or too calm wind conditions.
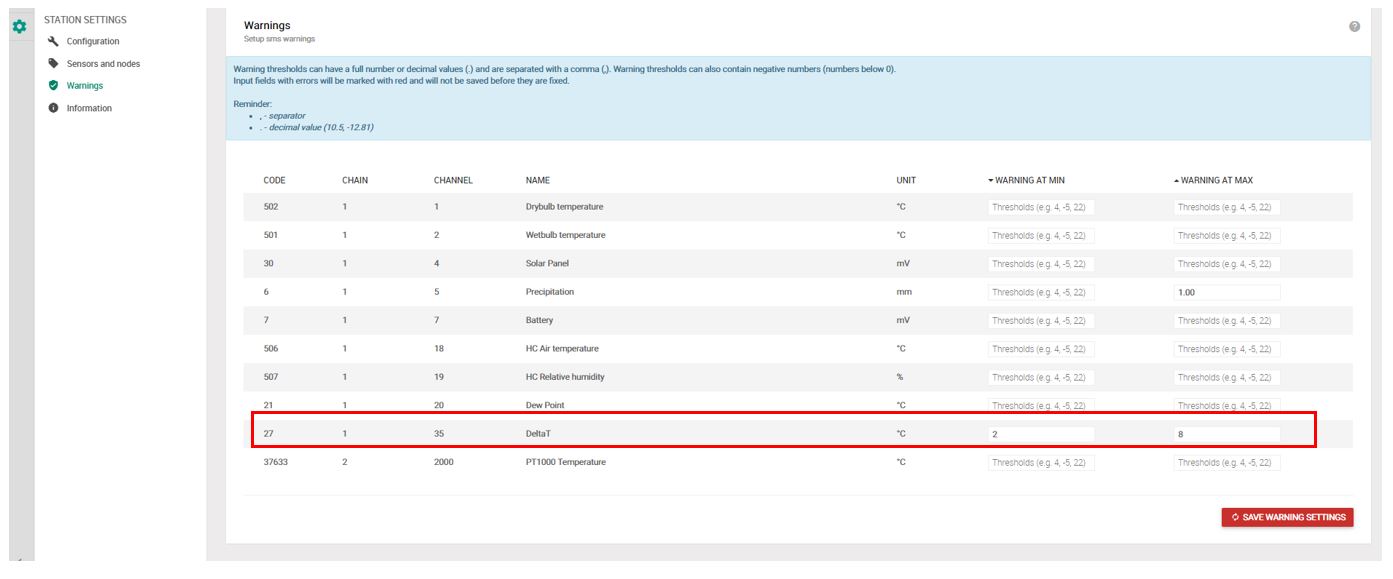
Figure 4: Insert Delta T marginal values in FieldClimate.
- Droplet survival will be very long leading to increased potential for drift – avoid spraying with RH>95%.
- Spray will not run off the leaf because of dew or fog.
- Avoid spraying during calm wind conditions – inversion layer therefore drifts.
- Avoid values greater than 10°C.
- Avoid spraying in air temperatures above 28°C.
- Potential impact on both droplet survival and evaporation rate: spray droplet will evaporate off the plant leaf before it has time to enter the plant tissue.
- Stressful situations for applying herbicides.
For the Decagon 5TE sensor it is now possible to calculate in FieldClimate the Pore EC according to the method illustrated in the 5TE Operators. Manual Version 3 – Decagon, derived form Hilhorst, M.A. 2000. To activate the calculation you have to switch it on in the Soil moisture configuration tool as indicated in Fig. 1. The calculation requires an offset term, which Decagon recommends to set equal to 6. This is also the default value inserted in FieldClimate, but it’s possible to change it in the relative box indicated in Fig. 1, since Hilhorst applies for different soils and media values between 1,9 and 7,6 and suggest to use an average value of 4,1.
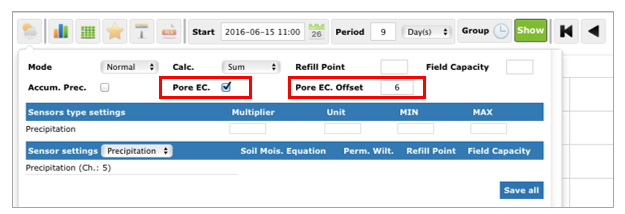
Figure 1 – Only for Decagon 5TE sensor: activation of the pore EC calculation and offset term setting.
IMPORTANT NOTE:
- Remember that Bulk EC, Pore EC and Solution EC are different variables.
- The applied model cannot be used in dry soil. As a rule of thumb, the model applies for most normal soils and other substrates, if VWC > 10% . In any case the calculation is valid only with bulk permittivity bigger than the offset term.
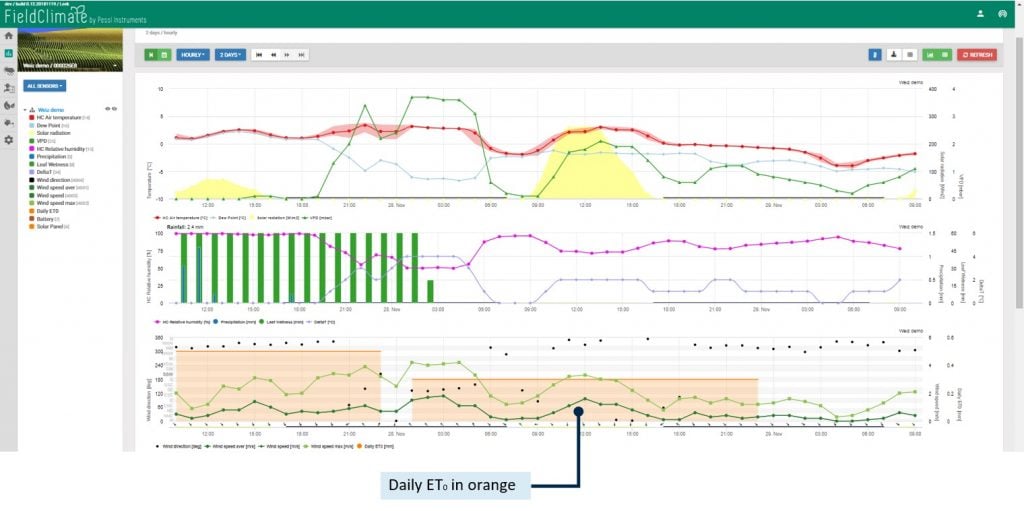
ET0 daily evapotranspiration is calculated with the FAO-56 Penman-Monteith equation and needs measurements (sensors) of:
- Air temperature
- Air humidity
- Solar radiation
- Wind speed
ET0 lets us know how much water the plant requires to grow each day, based on atmospheric demand. This water comes from root zone soil moisture and/or precipitation. On a typical hot day, a corn crop can use 7 to 9 mm or about 1/3 of an inch of water. In a week that could by 30 to 50 mm of water. This allow us to plan how much potential water is required to maintain crop health and yield.
Another Method to assess the evapotranspiration rates is the use of evapotranspiration pans.