
0. FAQ
This feature has been introduced in our new database system, but it will work only if the time zone of the device is set correctly. We recommend checking Station Setting > Configuration > Station Time Zone. If the station time zone is not properly set, you find a warning message. You can store the time zone simply by clicking on SAVE LOCATION. Yes, your names and units defined in the old version are imported and the system continues to overwrite with settings of the old version until you click on the DISABLE AUTO-SYNC button on Station Settings Page. If you are ready to use preferably the fieldclimate.com, we recommend clicking on this button to disable the automatic synching and your new setting will be regularly saved. Once you press this button for on of your stations, the setting is extended to all stations in your account.0.1. PREFACE
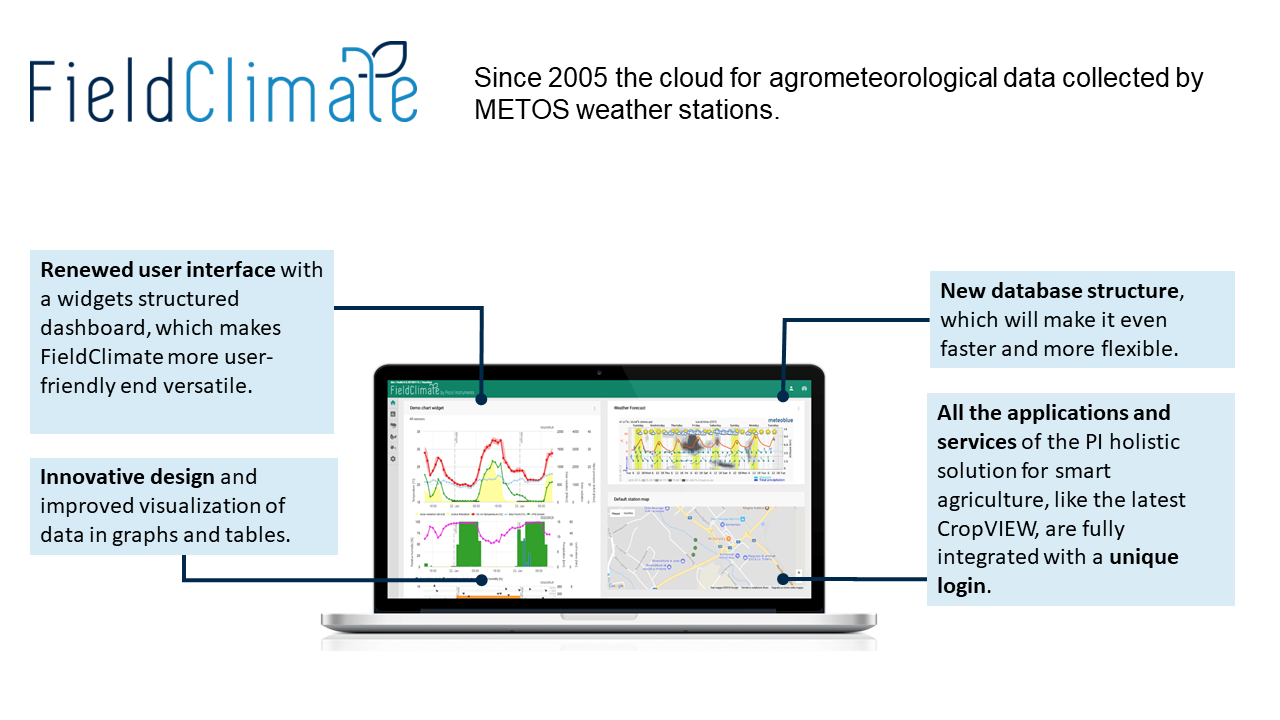
FieldClimate is the cloud platform used to present agrometeorological data collected by METOS® weather stations and data loggers. Key changes with the New Generation of FieldClimate:- Renewed user interface based on widgets
- Improved visualization of data
- Fasted and more flexible
- All METOS® services integrated into one platform as a holistic solution
1. HOW TO USE FieldClimate
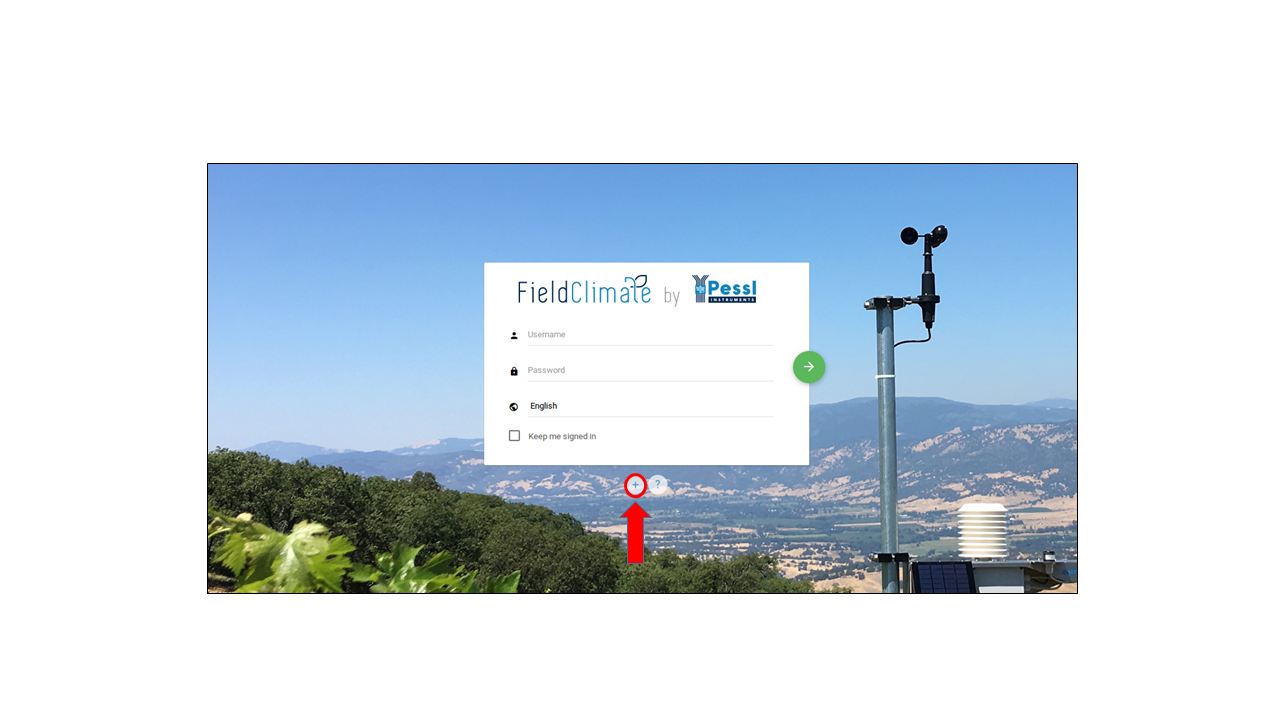
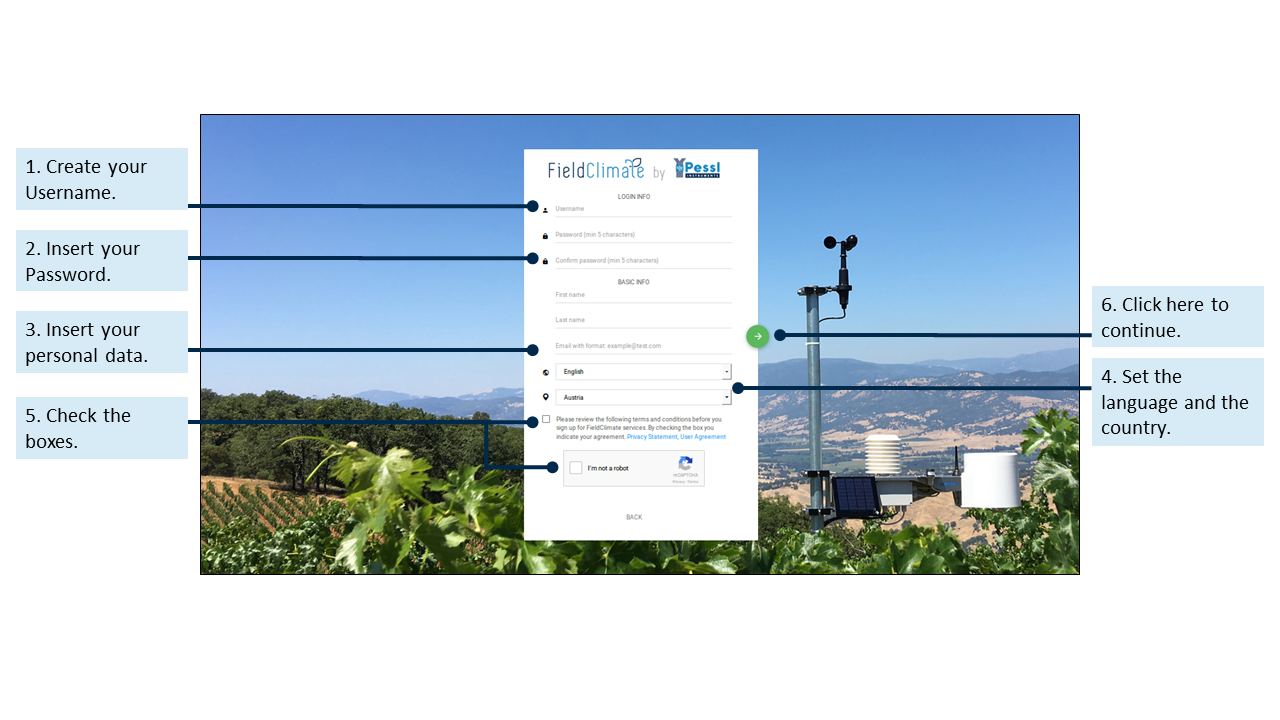
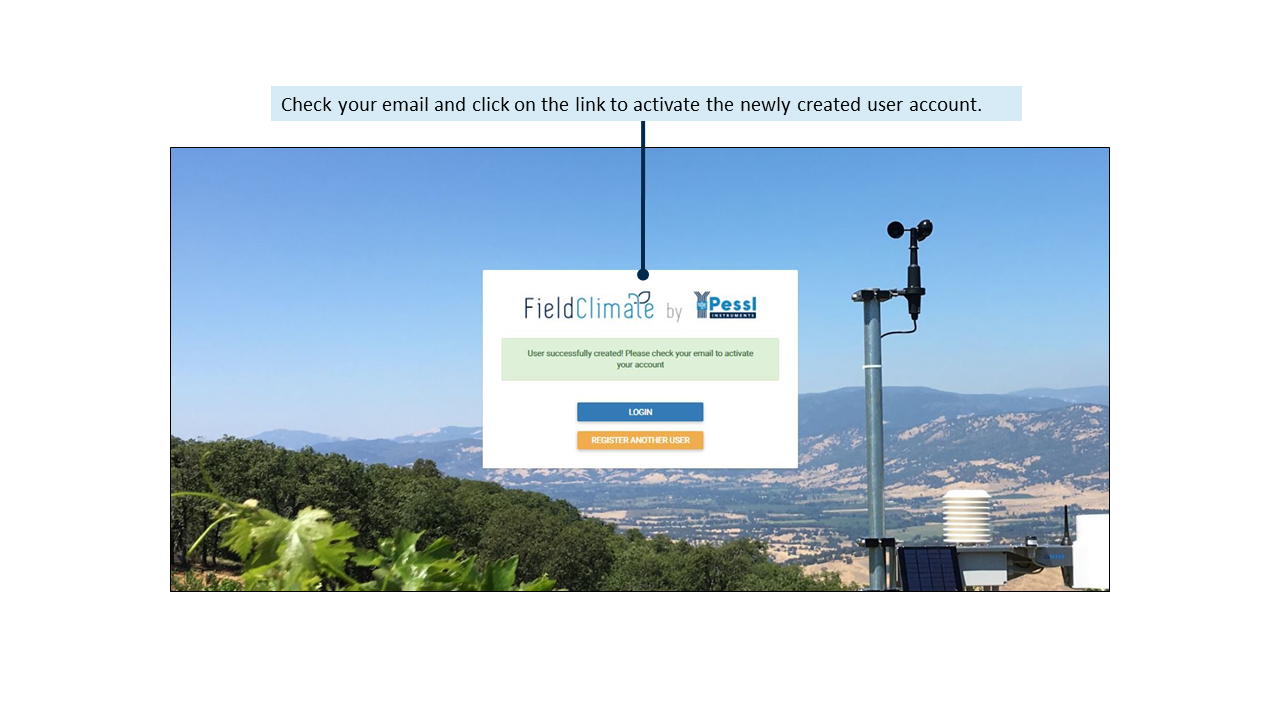
1.1. REGISTRATION
Go to
1.2. LOGIN
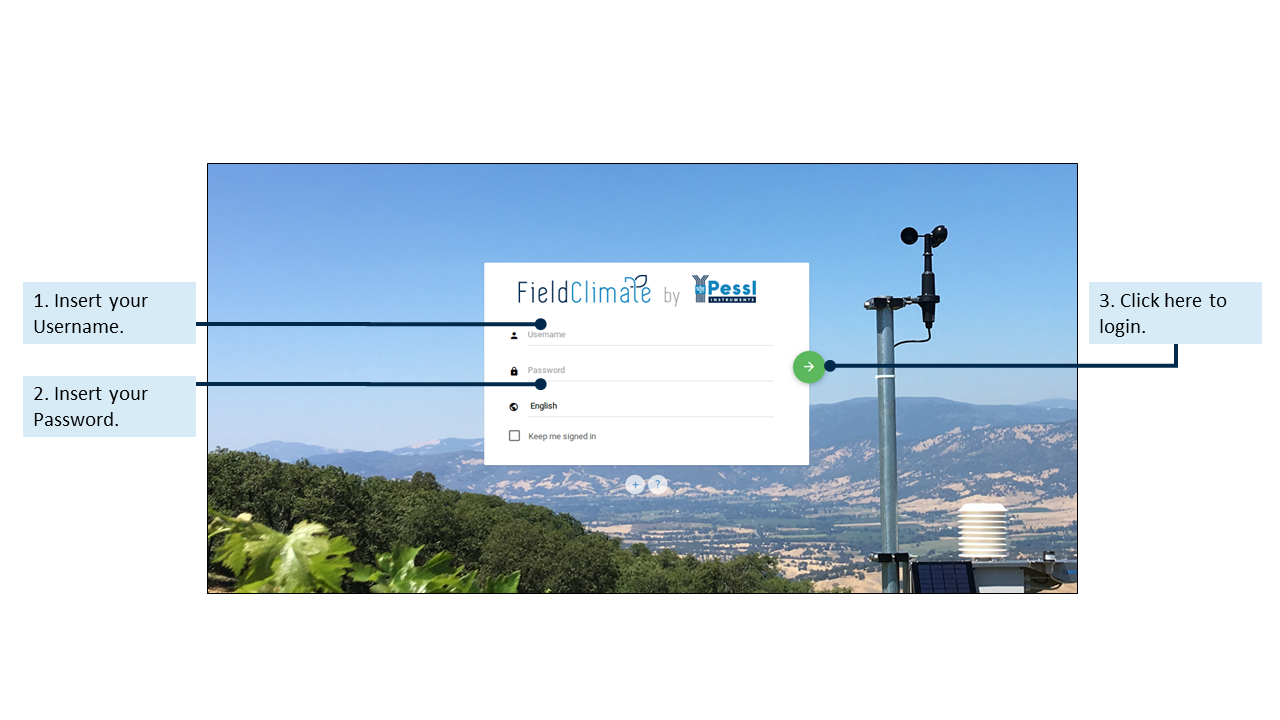 Once your account has been successfully created, insert your username and password to log in and the main dashboard will appear to you. In the top right corner, there are two icons which represent the first steps to using the powerful FieldClimate platform and setting the main configurations. The two icons symbolize (from left to right) the user menu and station list whose functions are explained below. Through the Navigation bar, which is located on the left side, you can select other pages or go back to the Main Dashboard.
1.3. USER MENU
1.3.1 ADD/REMOVE STATION
Click on the icon user menu: here you can add or remove stations and access to other user settings. To add your device, click on user menu > Add/Remove station. It will ask you for a Station ID number and a station key. Now the little silver colored sticker which came with your METOS® has to be used. This sticker contains two keys. Key 1 gives the power to change all the settings on the METOS® whereas key 2 is only valid to see the data of the system. To be able to set up the METOS® please enter the key 1 here. If you entered the correct key your station list will be enlarged by this METOS® and it can be selected. In User Settings password can be changed.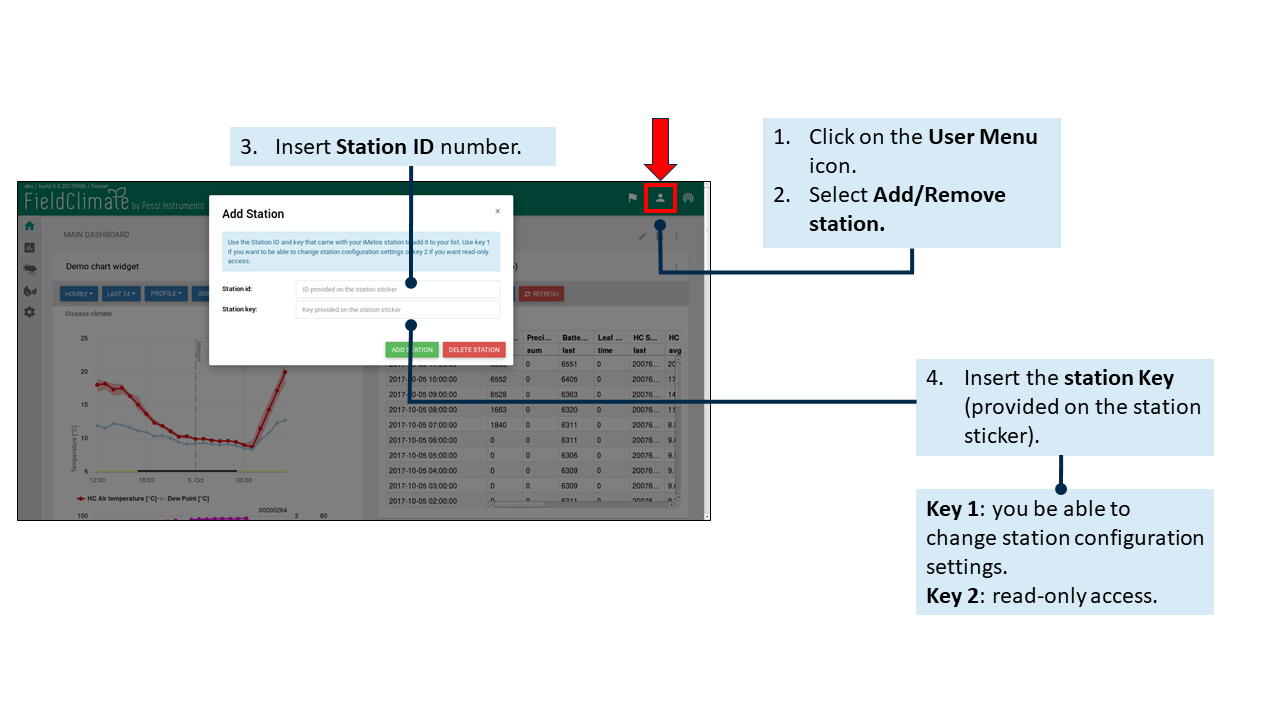
1.3.2 USER SETTINGS
Click on User menu > User Settings to change and update the user settings. In particular, you can update the password, personal information and more settings like the language and the unit (metric or imperial). Remember to update the settings once you finished.1.3.3 API SERVICES
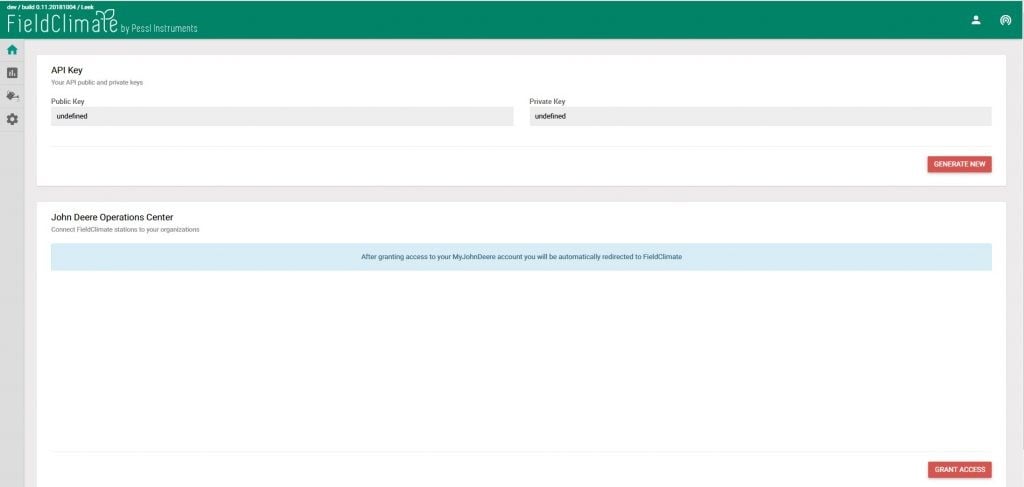
CONNECTING FIELDCLIMATE TO THE JOHN DEERE OPERATION CENTRE 1. User menu > API services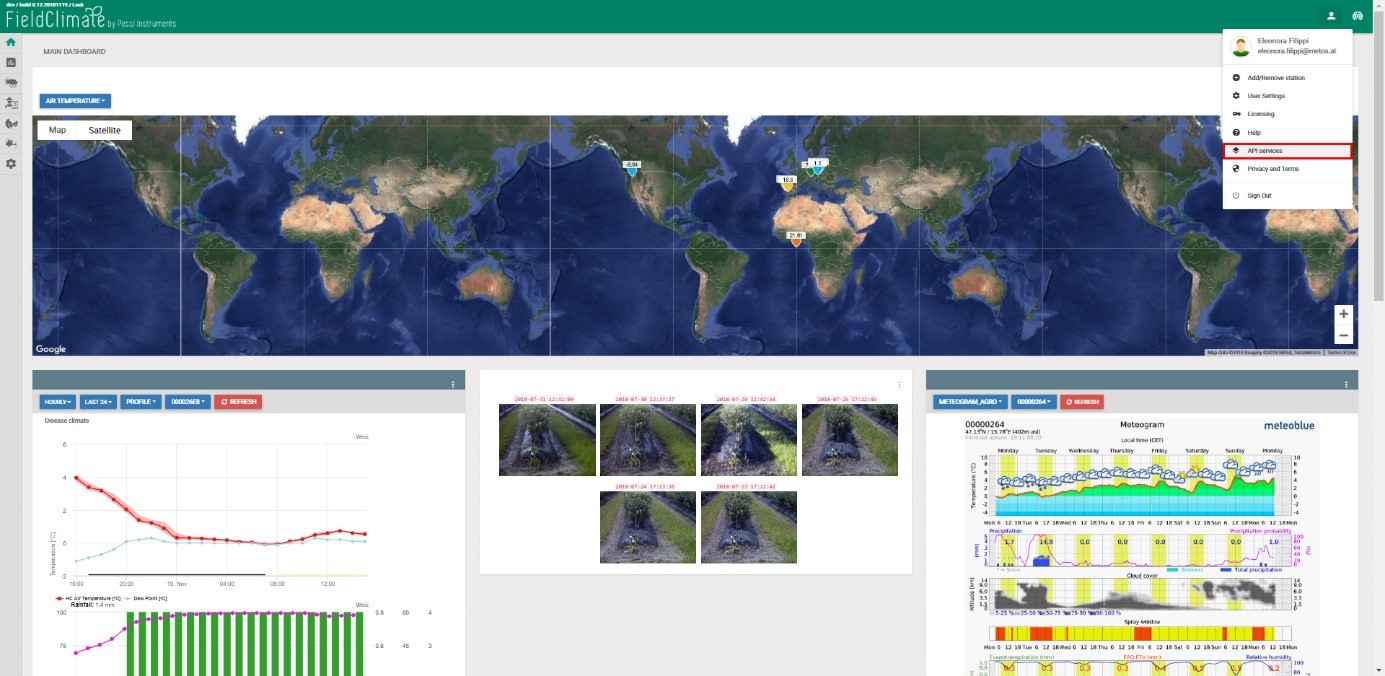 2. Click the “GRANT ACCESS” button, and this may take a couple of minutes, but you will be redirected to the John Deere Operations Centre Organization. Note: in order to be redirected you need to have a John Deere Operation Centre account.
 3. You will be asked to connect to a John Deere account. Click the “ALLOW” button and also check the “Don’t ask me again for this client” box
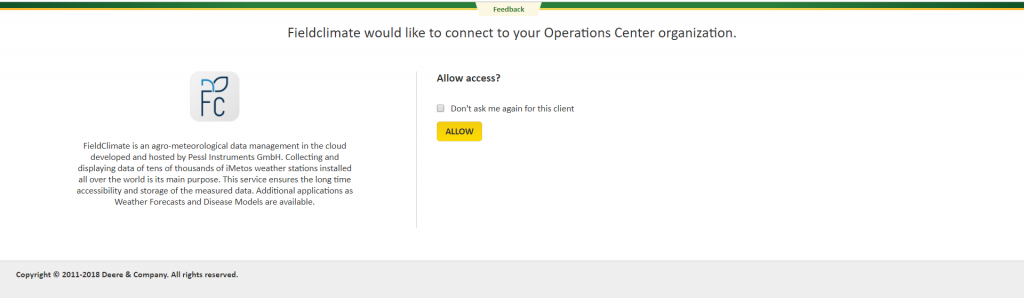 4. In FieldClimate choose the John Deere Organization you want to connect with. You will then be presented with a list of stations/devices. Click YES to which ones you want to connect to the John Deere Operation Center. All stations/devices will be listed, but only the ones to that you have Key 1 access to will be connected. In other words, key 2 stations cannot be connected to My John Deere.
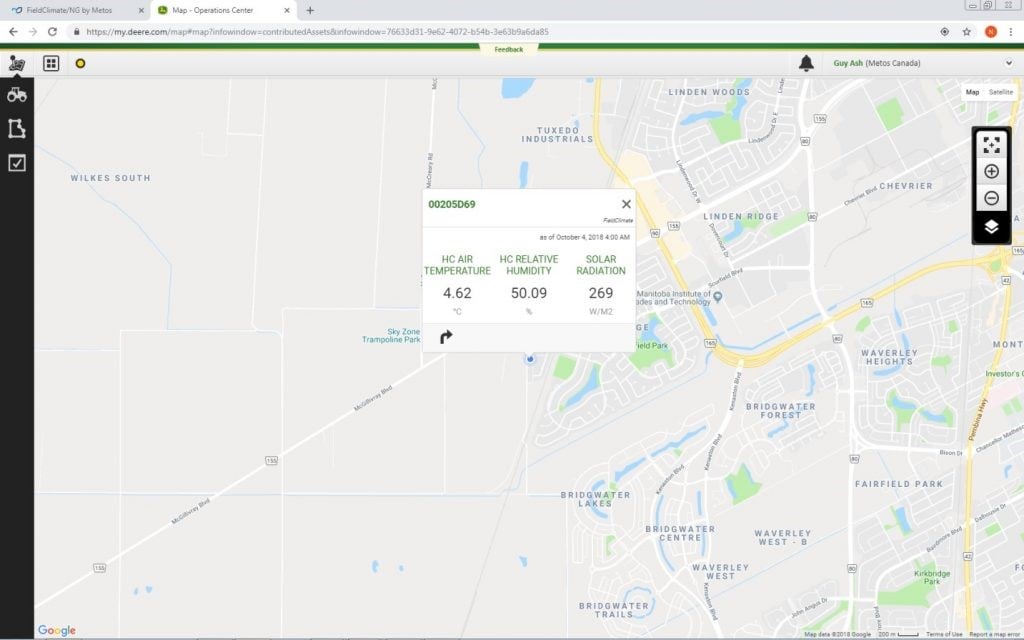
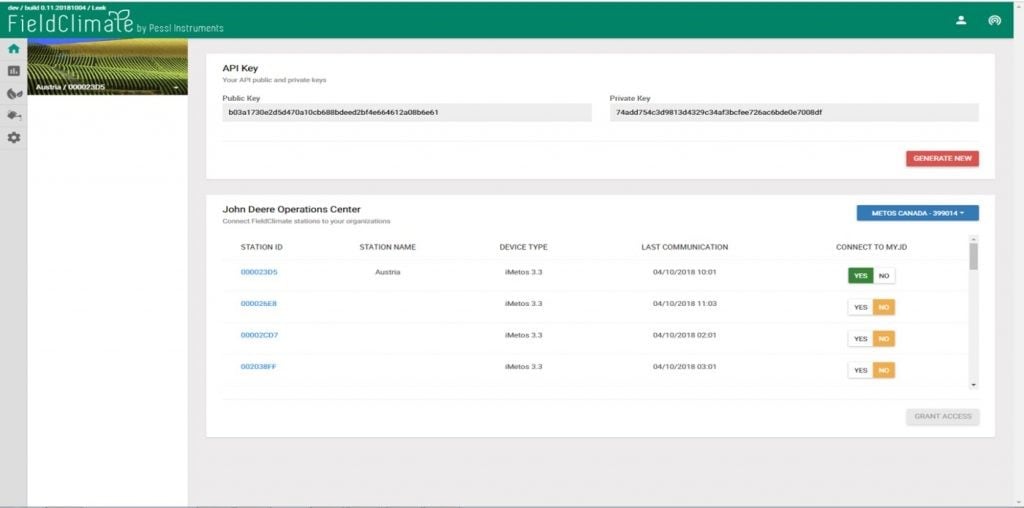 5. Once you have been granted access to the FieldClimate stations/devices you will be connected to the John Deere Operation Centre (image below).
 6. If you want to add stations or devices later, you can by clicking YES to connect to my John Deere. Again, to add a station/device you need to have Key 1 access.
1.4 STATION LIST
Click on the Station List icon which allows you to choose among all the METOS® devices and select a single one. Each station has its own serial number, custom name and its last communication: you can find the station by name or serial number. It is possible also to see if the METOS® device has the plant disease or weather forecast subscription active. Remember that for these services you need to have the corresponding subscriptions active.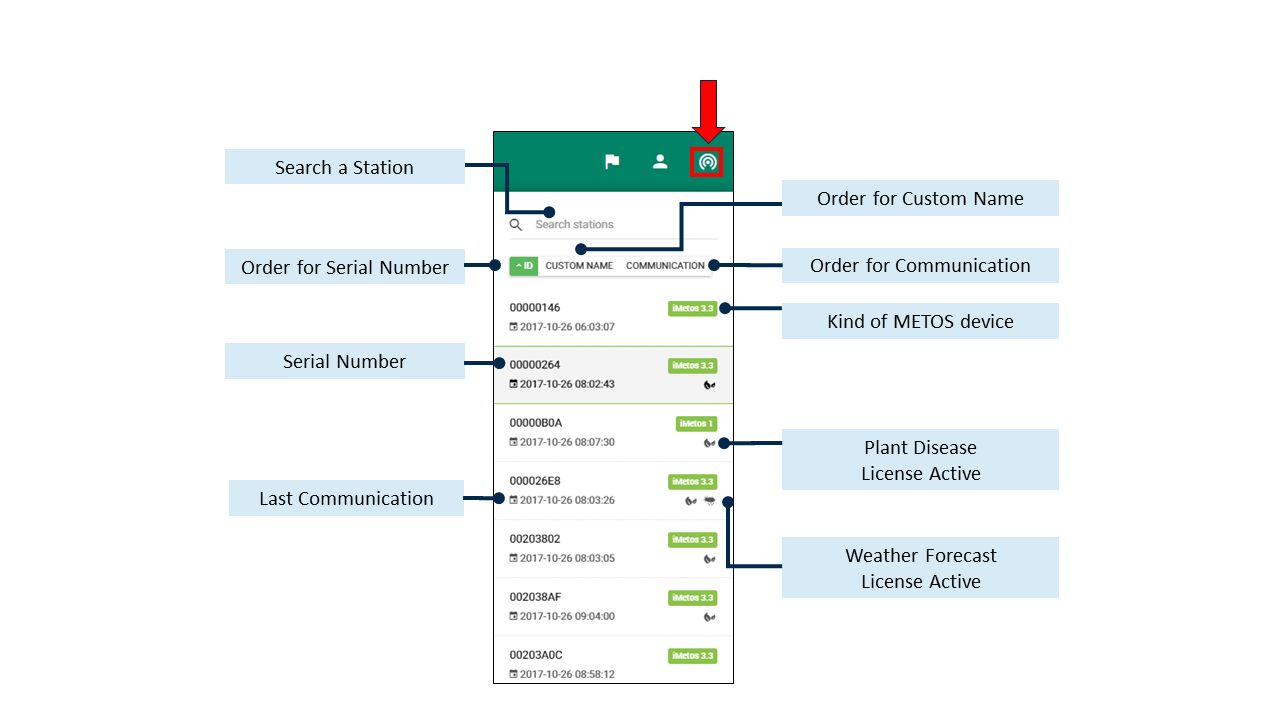
1.5 NOTIFICATIONS LIST
Notifications can now be seen on the server level, as a list on the top-right menu of FieldClimate. Apart from the individual notifications page, inside station settings, users now have a dedicated page to access all notifications, from all stations, in the same place. The notifications list counts with: a list of unread alerts, a history page with all the historical notifications, and a configuration page for general editing.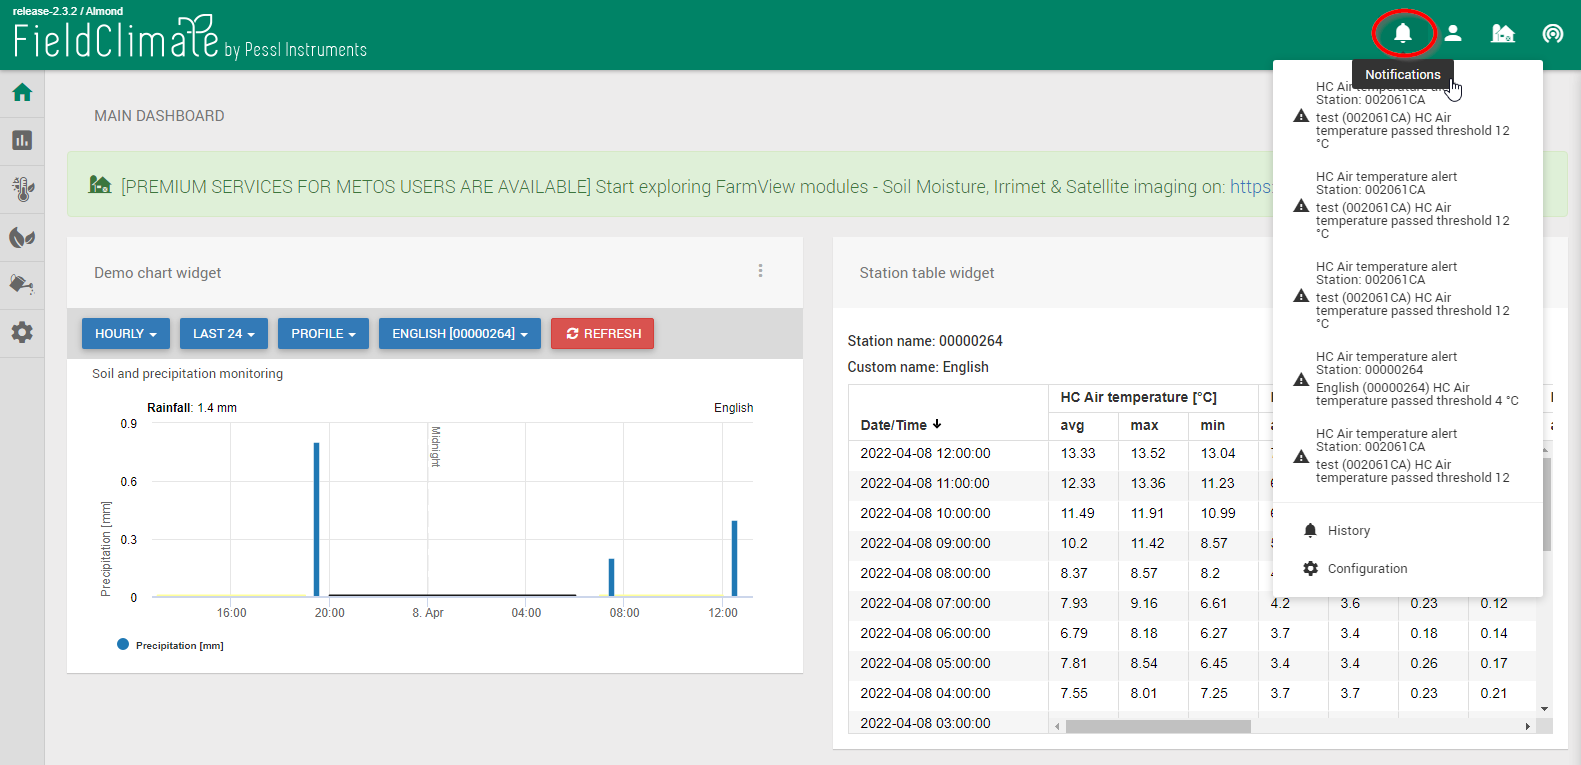 In the History section, users can see all the notifications. While, on Configuration, you can create new alerts per station ID, likewise, check all the existent alerts for that particular station.
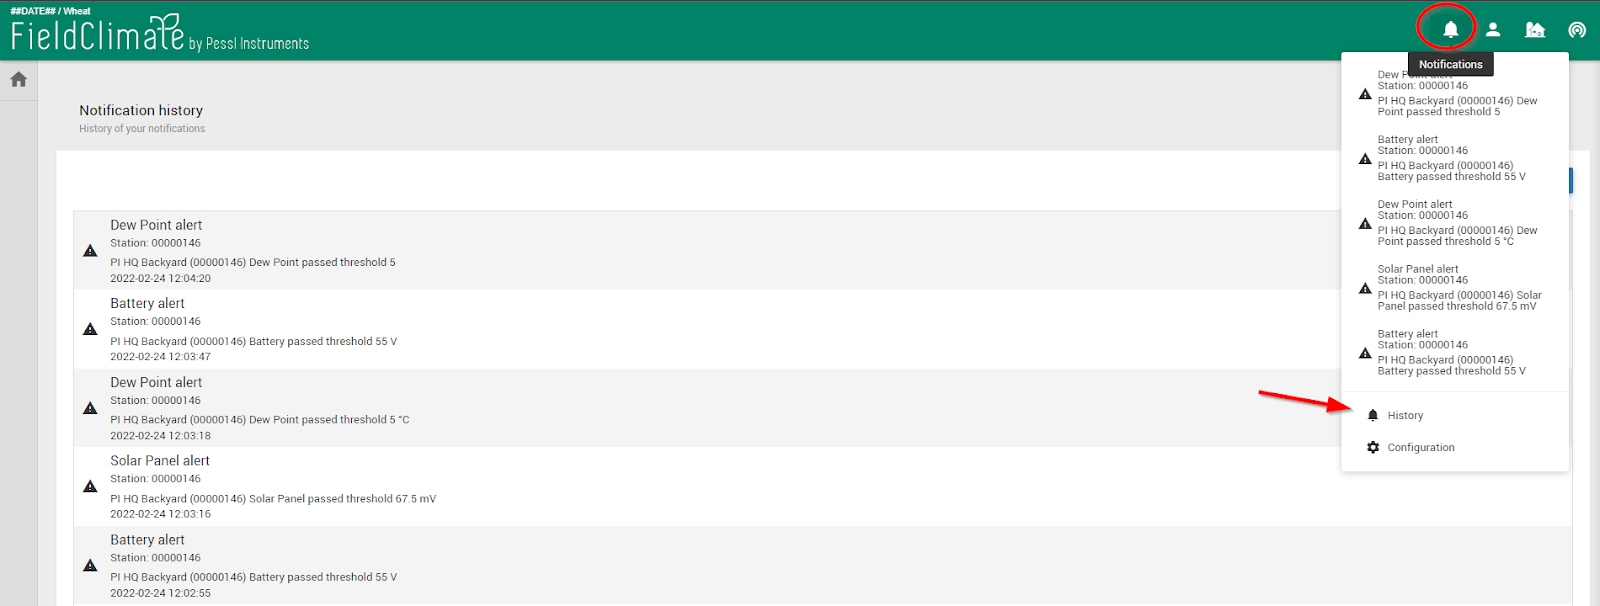
Below is the history page:
In the History section, users can see all the notifications. While, on Configuration, you can create new alerts per station ID, likewise, check all the existent alerts for that particular station.
Below is the history page:
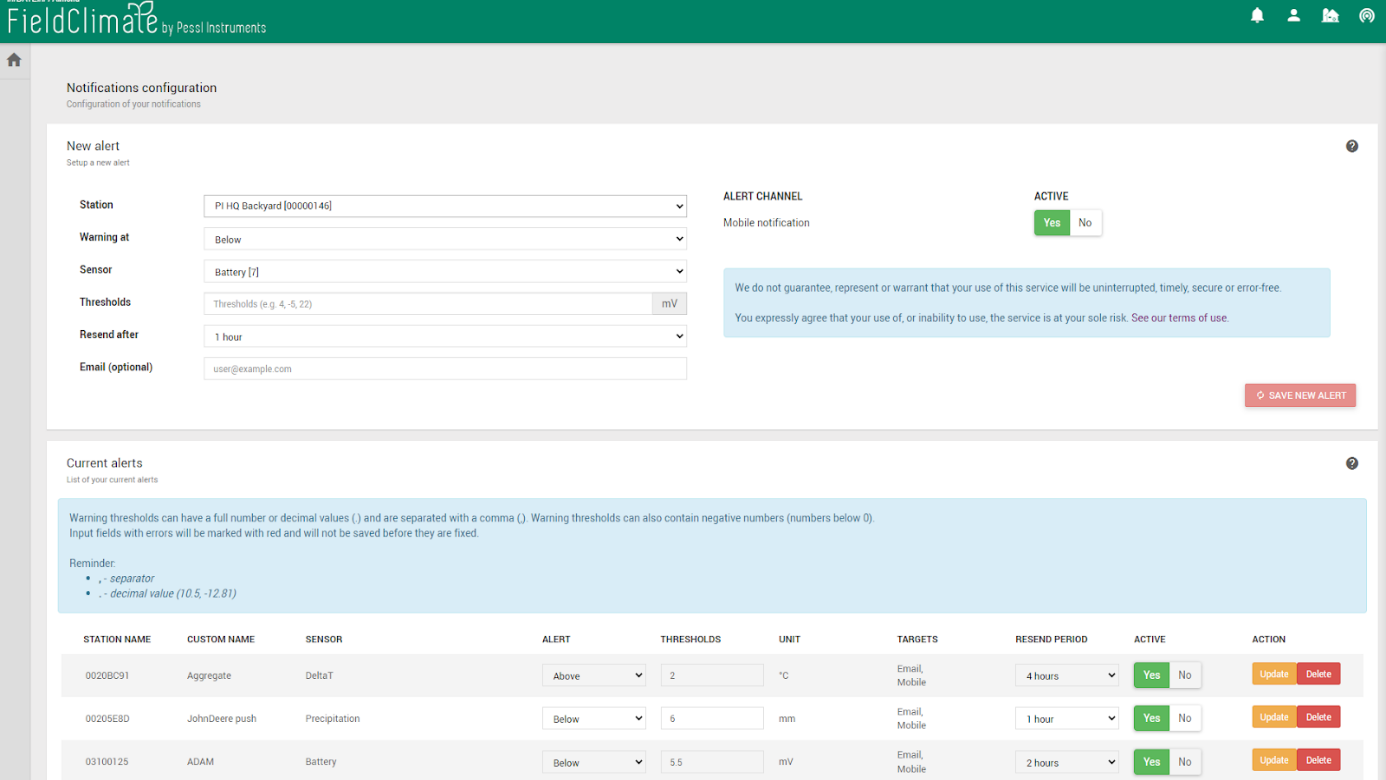
 Below is the configuration page:
2. MAIN DASHBOARD
2.1 DASHBOARD SETTINGS
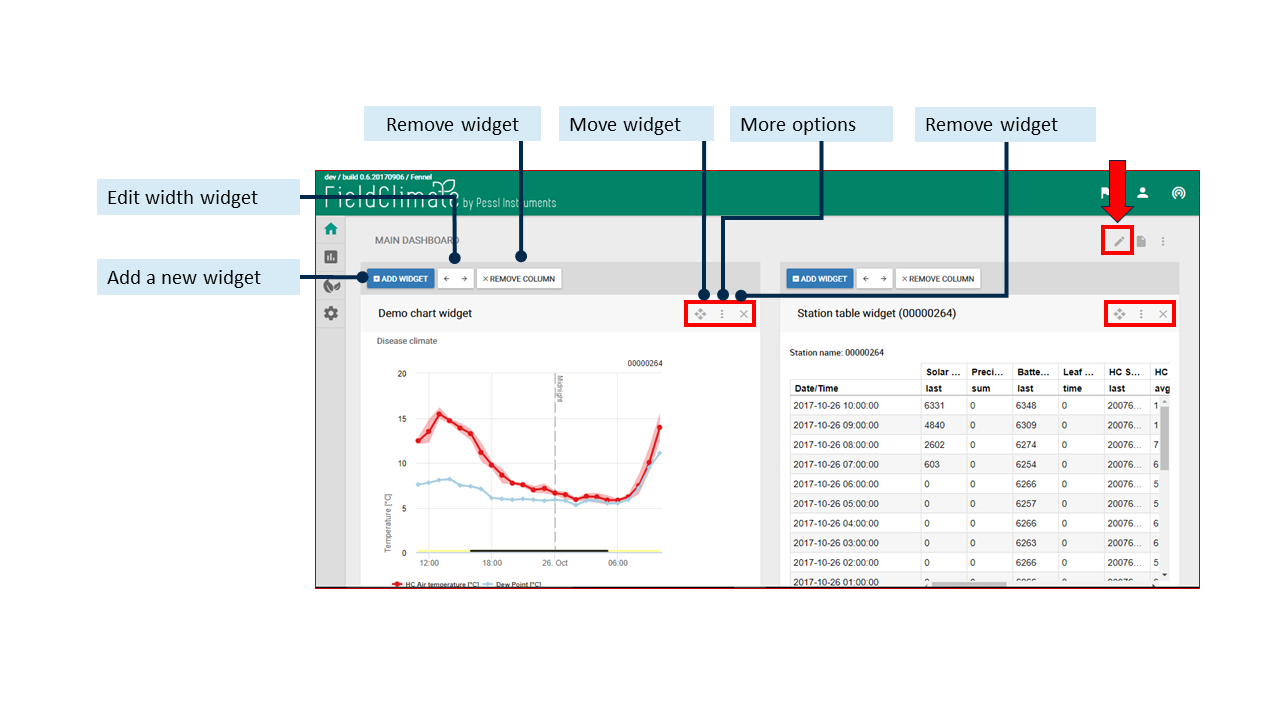
Thanks to the new Dashboard, with a widgets structure, the user can manage better the fast access to the services of highest interest between historical data, localized high-precision weather predictions, disease models, soil moisture data, CropVIEW images, insect traps and other DSS (Decision Support Systems). When you selected your METOS® device, the site will reload and you will see the main Dashboard. You can completely customize the Dashboard with data of your interest (tables and graphs). For example, you can edit the Dashboard by adding or removing widgets.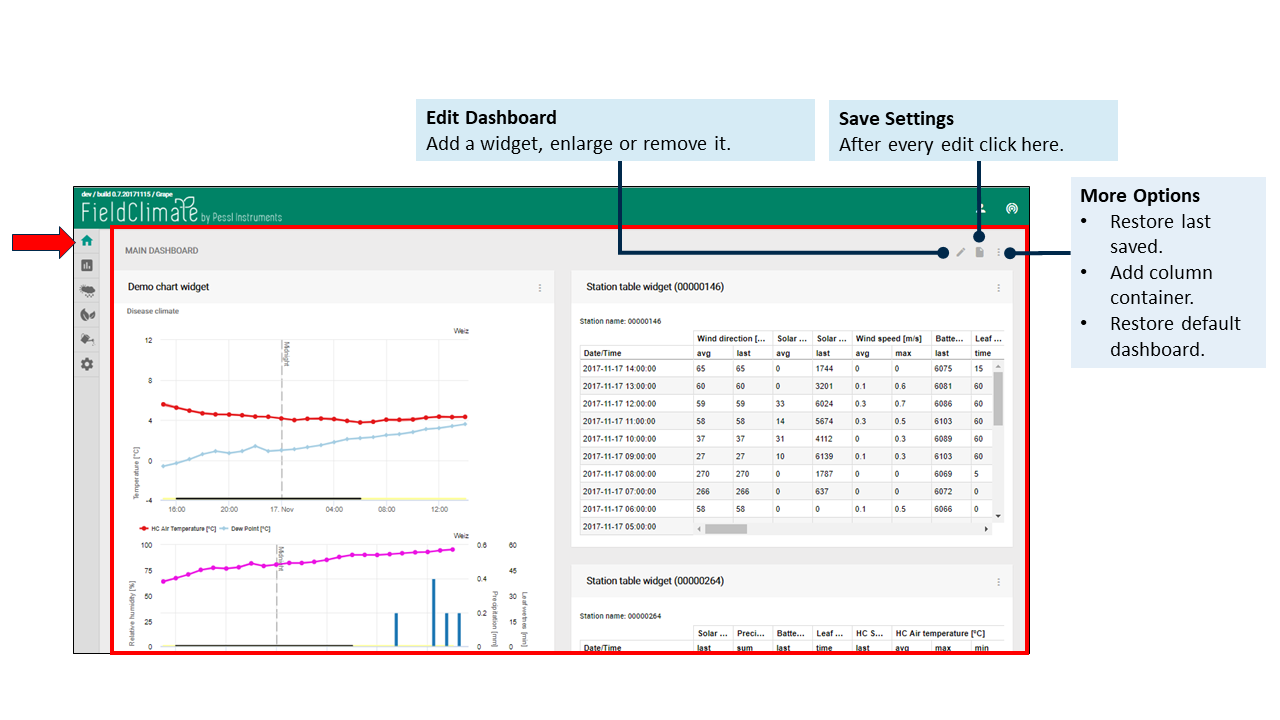 Clicking the “Edit Dashboard” button, a bar over each widget will appear whereas you can add one, edit its width or remove it.
2.1.1 ADD WIDGET
Click the “Add Widget” button and a new window will appear you have to insert the:- Select the widget type.
- Insert the widget title.
- Insert the widget descriptions and choose the colour for the window.
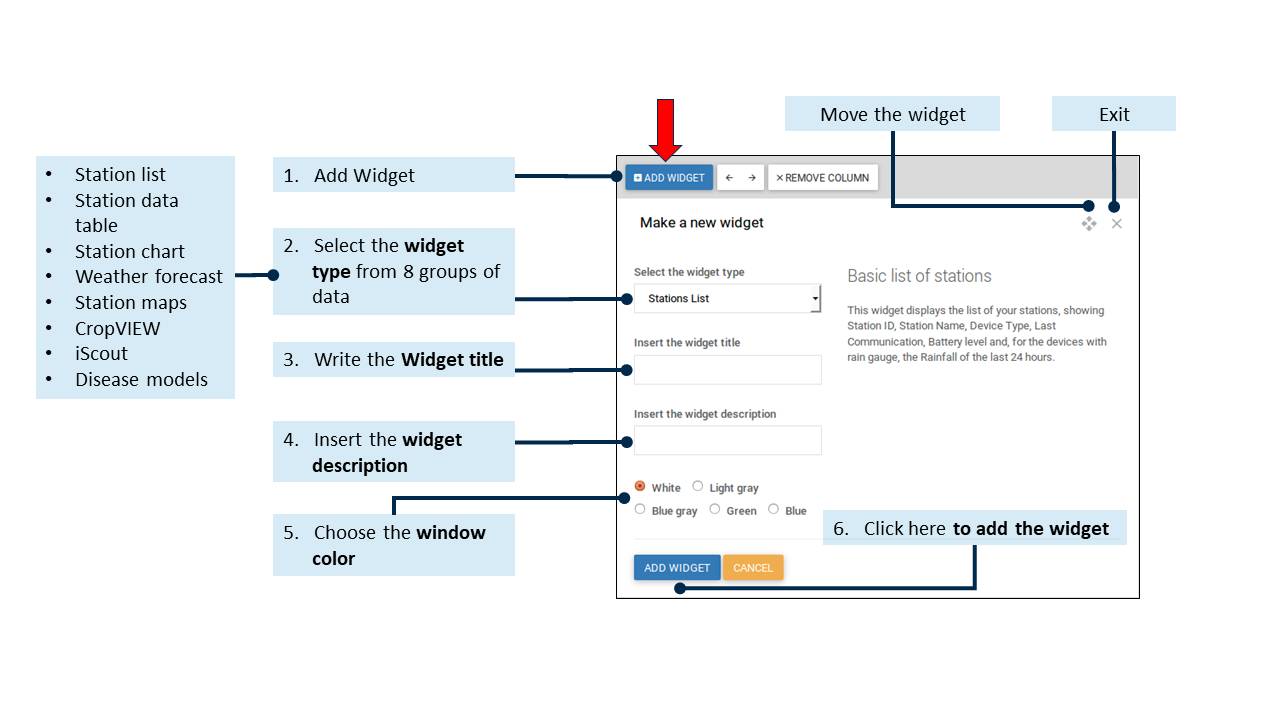 Now you can choose the widget type from: Station list, Station data table, Station chart, Weather forecast, Station maps, CropVIEW, iSCOUT and Diseases models.
2.1.2 WIDGET SETTINGS
Click “More options” and more edits appear. You can also move the widget into the Dashboard or remove it. In addition to that, you can group the data hourly or daily and select the last period of time to display (8h, 24h, 48h, 72h). If you click the “Profile” button you can choose the type of data between All sensors (it includes all the sensors connected on the METOS® device) and the other groups such as Disease climate, Growing climate, Wind monitoring, Frost and Temperature monitoring Soil or Precipitation monitoring. Be sure to click the ”Refresh” button after making any changes to all settings, otherwise, edits will be lost.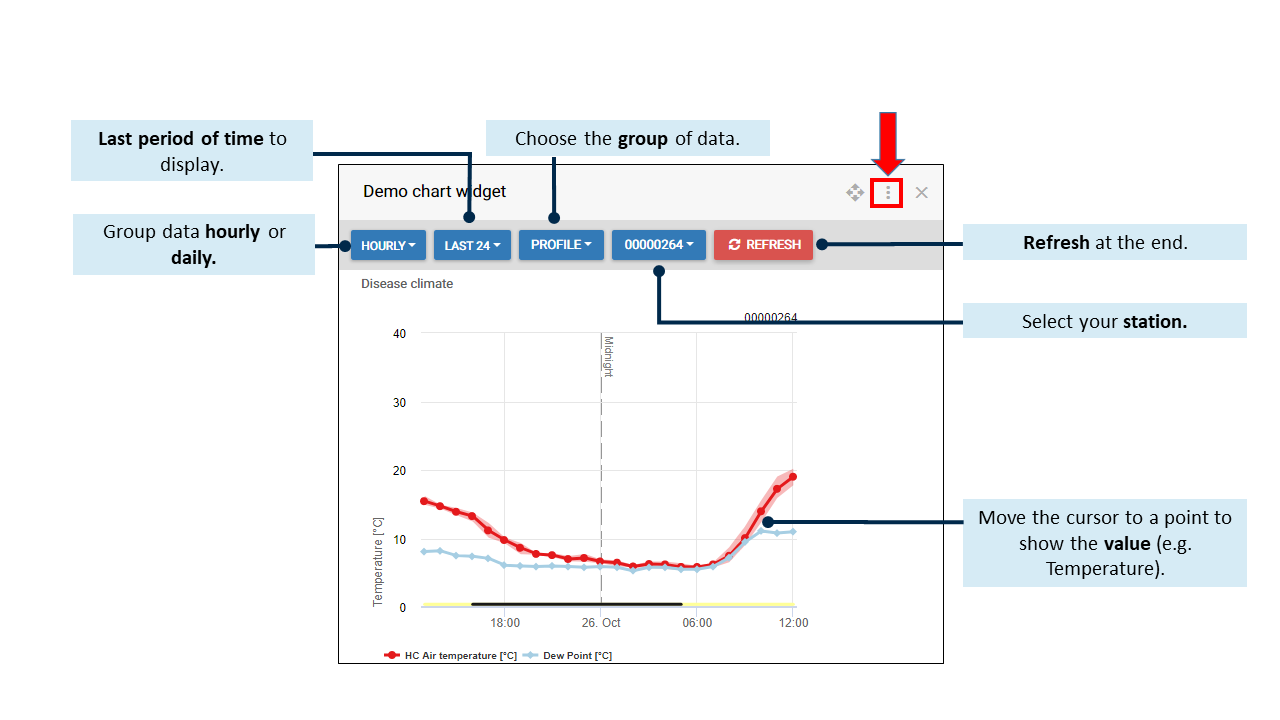
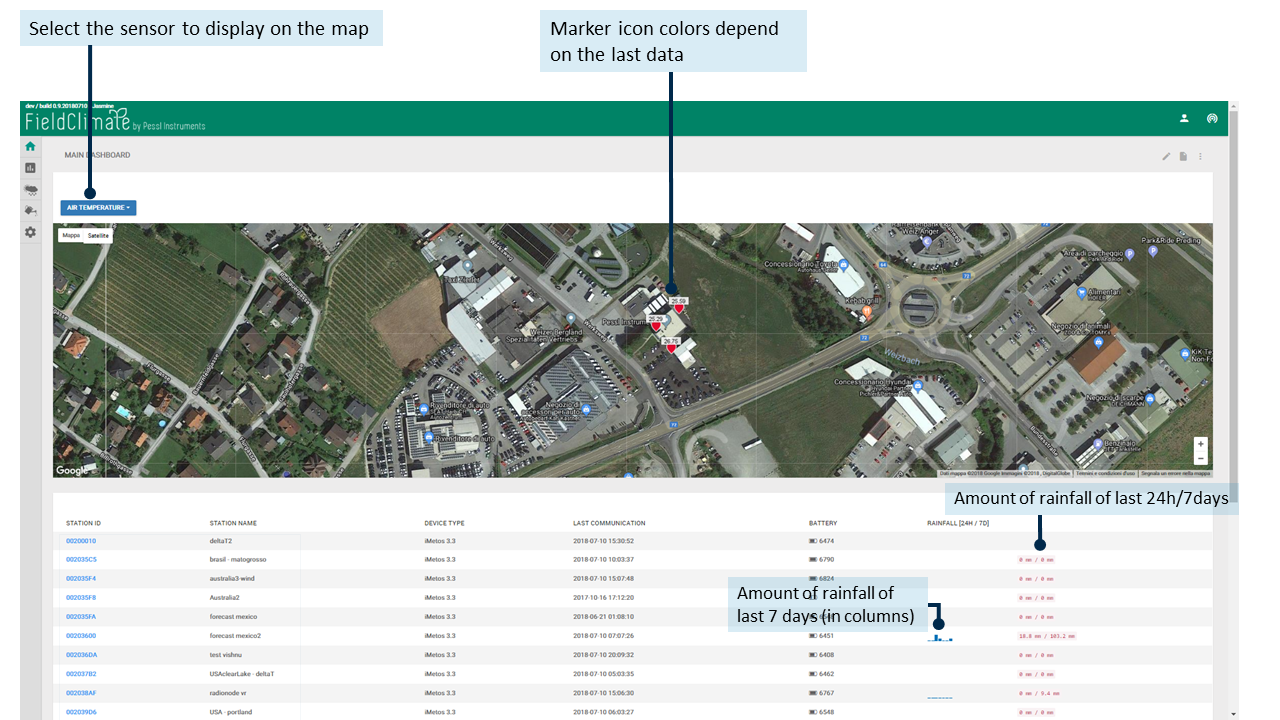
2.2 DASHBOARD STATION-LIST WIDGET
The station-list widget is located on the FieldClimate dashboard page. With this tool, users can easily evaluate station conditions regarding battery, last communication, and other selectable sensors such as rainfall, air temperature, etc. Other than data display, it is also possible to download the customized list as an excel file.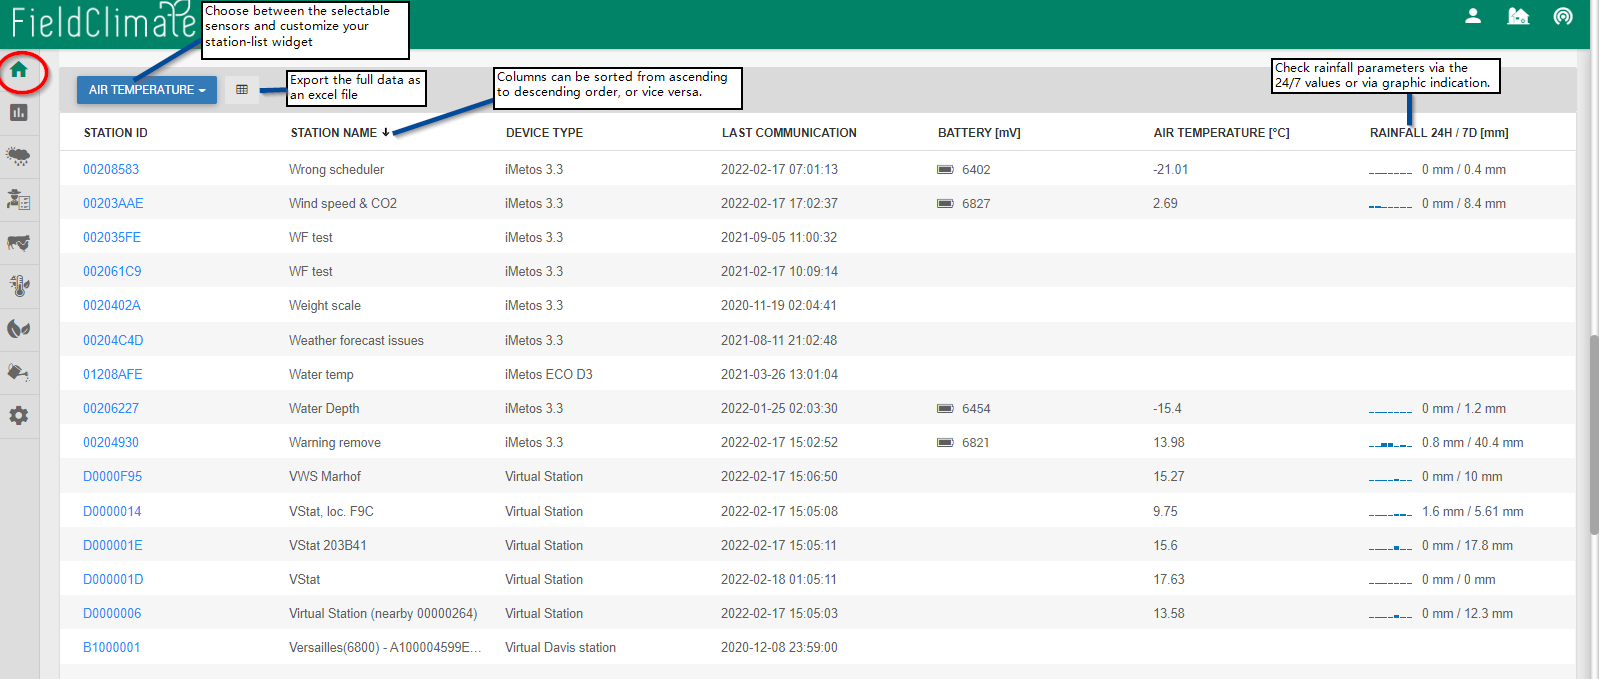
2.3 DASHBOARD WORK-TRACKING WIDGET
Work Tracking trips can be visualized and compared on your dashboard page. A widget can be created under Dashboard (three dots) -> add a 1 column container -> create new widget -> select ‘Work Tracking’ from the drop-down menu -> save.2.4 DASHBOARD WIND ROSE WIDGET
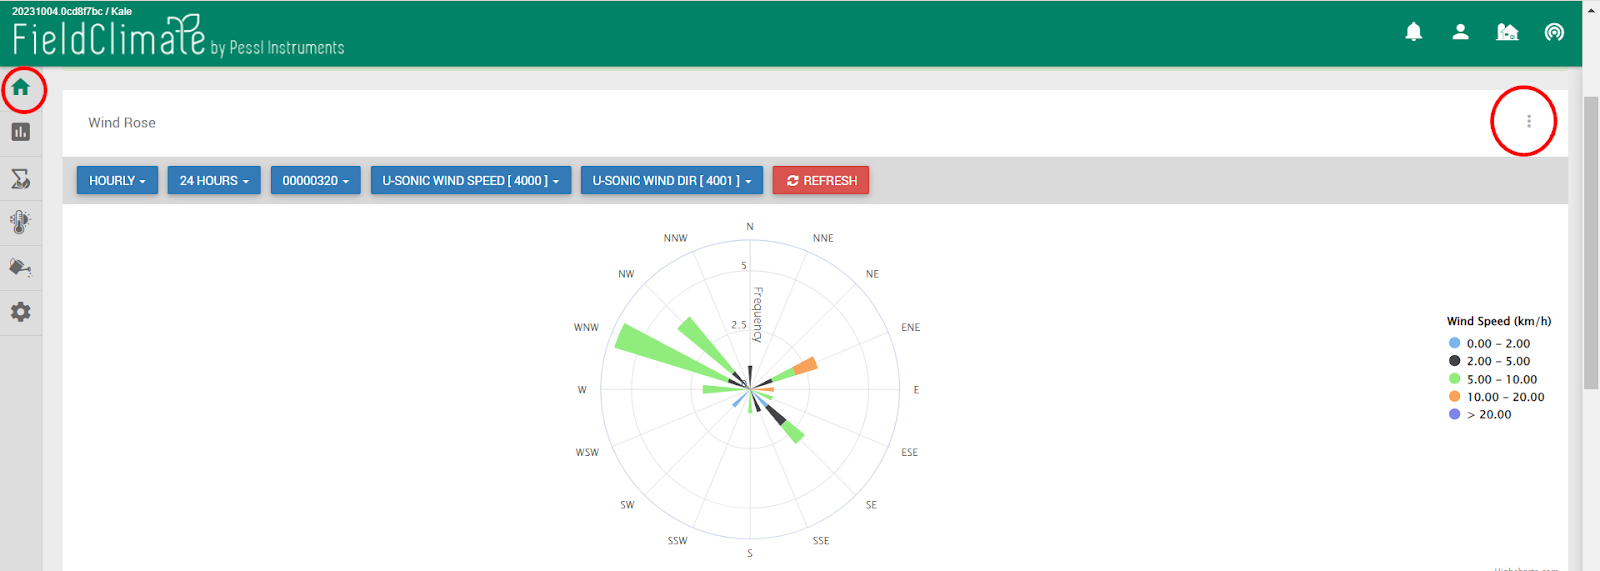
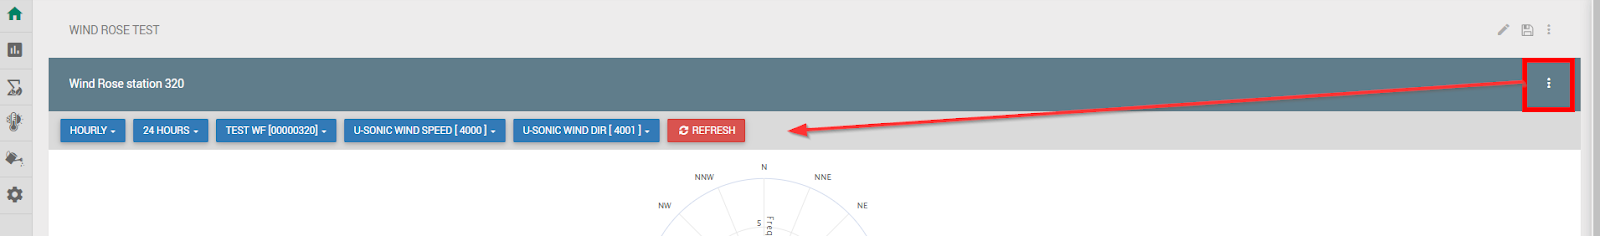
The Wind Rose is a chart which gives a view of how wind speed and wind direction are distributed at a particular location over a specific period of time (wind direction and intensity). To see the Wind Rose, you need to have a wind speed and direction sensors connected to your METOS weather station. How to interpret the Wind Rose chart? The wind rose represents the direction of the prevailing wind by the length of the rays. The ray points to the direction from where the wind is coming from and its length shows the frequency of this direction. The colors mean wind speed, the longest color is the most frequent. The wind speed ranges are fixed, and they depend on the sensor unit set (km/h, m/s, mph…).- 0-2: the blue part of the ray demonstrates calm or very low wind speeds;
- 2-5: black color indicates light air;
- 5-10: green rays represent a light breeze;
- 10-20: the orange color represents a gentle breeze;
- >20: violet color indicates the maximum wind speed displayed in the wind rose.
 How to see the Wind rose in Fieldclimate?
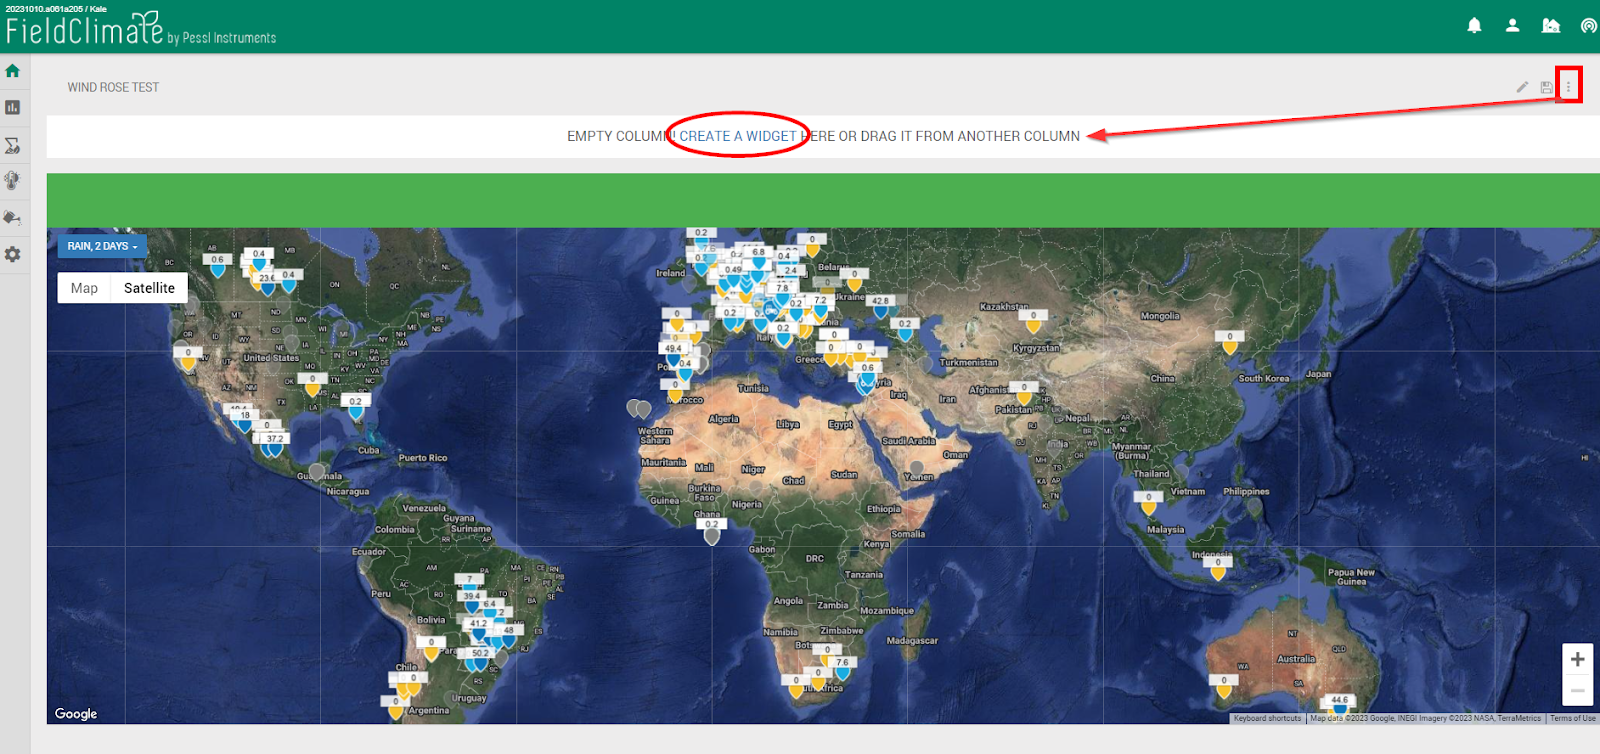
- Click on the icon with three dots on your dashboard top right.
- Select one of the options to add one or more column containers.
- Click on “Create a widget” and select “Wind Rose diagram”.
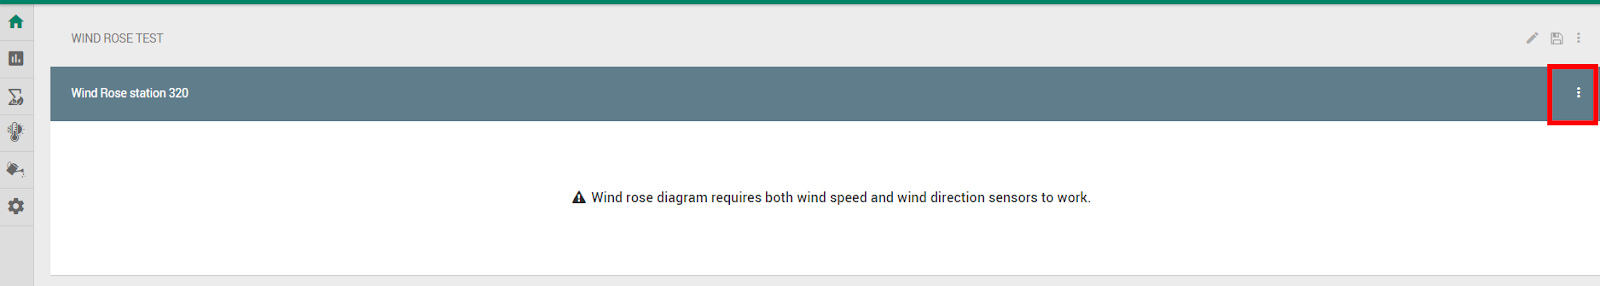
- Once clicked on “Add widget” you will see the Wind rose container -> to see the filters and chart click on the icon with three dots again.
- Filters will show up -> Source of data (raw or hourly data), period interval (going back maximum to 1 year of measured data), the wind speed and direction sensors (it is auto-selected per default) and the station SN need to be selected by the user.
- Remember to SAVE on the top-right corner of the Dashboard.
3. ACCUMULATOR TOOL
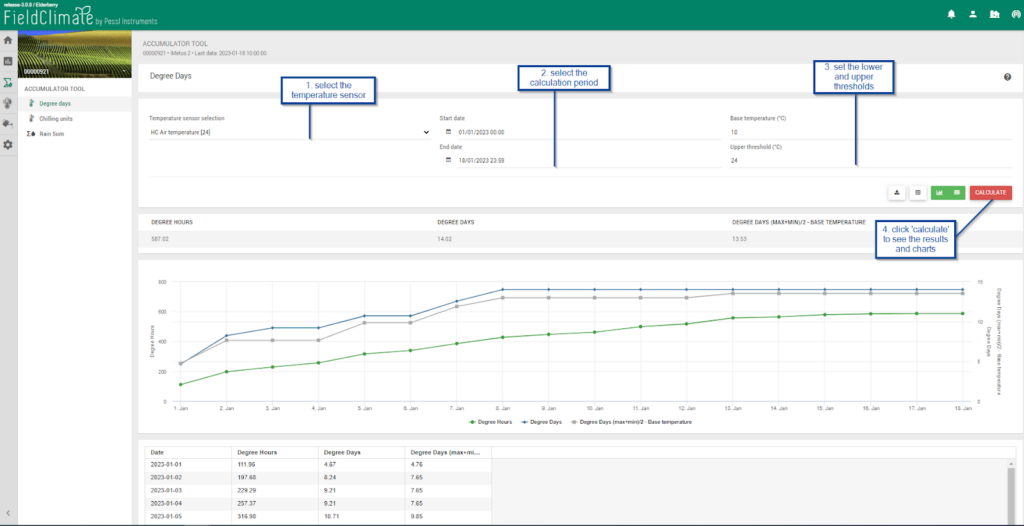
3.1 DEGREE DAYS
3.2 CHILLING UNITS
The Utah model is more complex because it introduces the concept of relative chilling effectiveness and negative chilling accumulation (or chilling negation). According to Richardson et al. (1974) temperatures between 0 and 16°C promote the breaking of rest, whereas temperatures > 16°C negate such effects. Maximum promotion occurs at 7°C (1 h at 7°C = 1 chill unit); higher and lower temperatures within the 0-16°C range are less effective. This model has been modified as more information has become available. The Positive Chill Units (PCU) model is a modification of the Utah Model, which does not consider the negative values for the chill accumulation, and which is designed for situations where, because of the abundance of high winter temperatures (temperatures > 16 °C), the final values are negative. This model has been found to give a more accurate estimation of winter chilling in areas with mild winters or subtropical climates.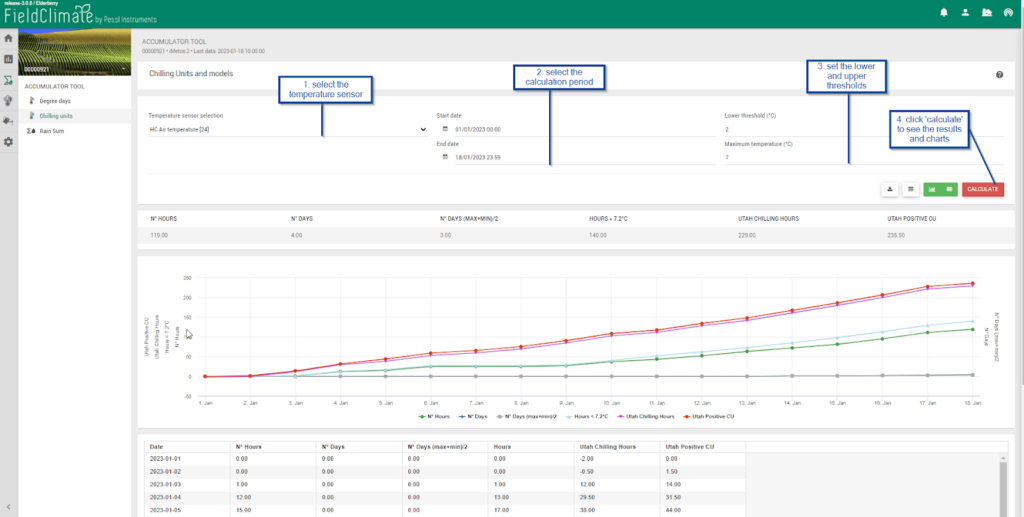
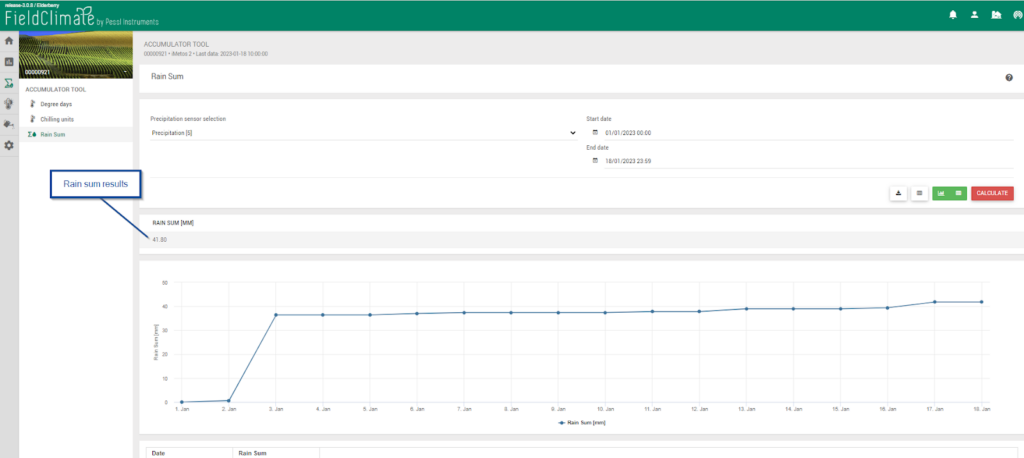
3.3 RAIN SUM
4. WEATHER FORECAST PAGE
For iMETEO you need to have the corresponding subscription active. It is a joint product of meteoblue and Pessl Instruments. It combines past data with a forecast of the main meteorological variables on an hourly basis for 7 days. An METOS® station is needed: the observation data is sent to the www.fieldclimate.com/login database, and the weather forecast is automatically adjusted to the conditions of the specific METOS® weather station. Data can be additionally combined with spray conditions, growth, irrigation and disease forecast models. On the Weather Forecast page, you can choose different ways to view the weather forecast on your site. Details: 3 days weather forecast as default, you can also see the next 7 days. Parameters calculated hourly: air temperature (°C), precipitation (mm), probability of precipitation (%), wind direction (deg), wind speed and gust (m/s), relative humidity (%), daily evapotranspiration (mm), leaf wetness, global solar radiation (W/m^2), cloud cover (%), surface air pressure (hPa).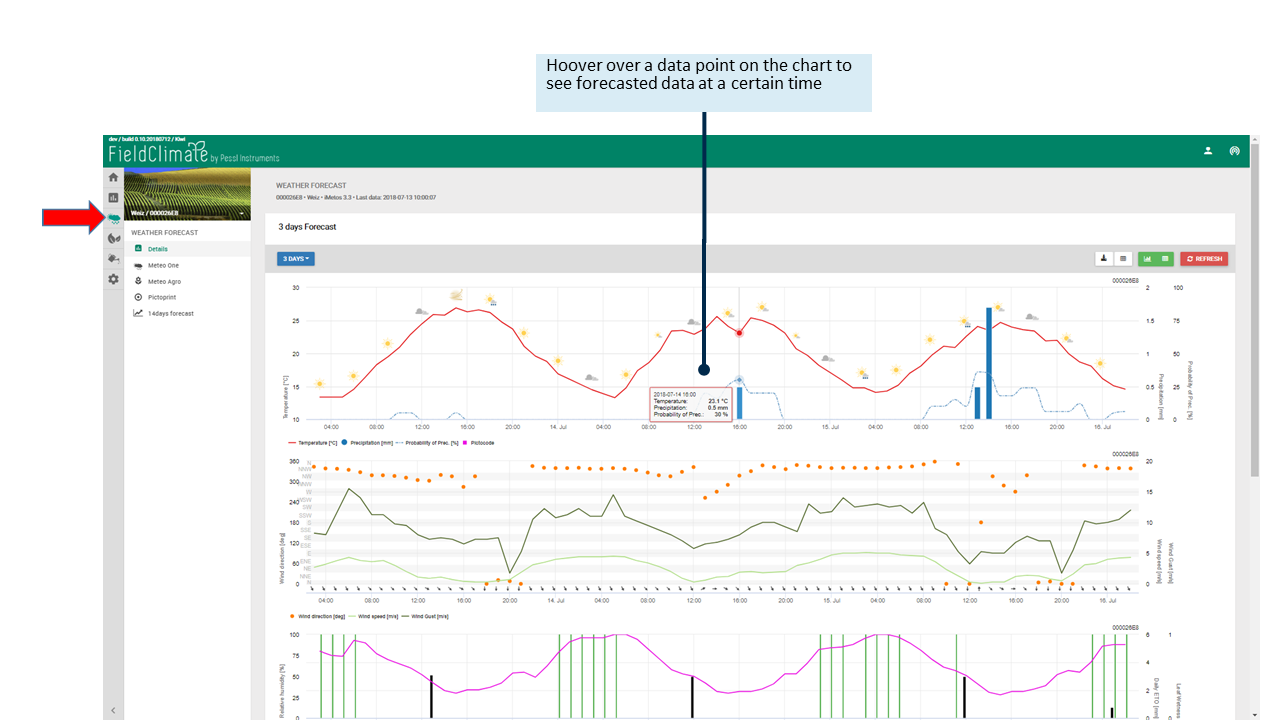
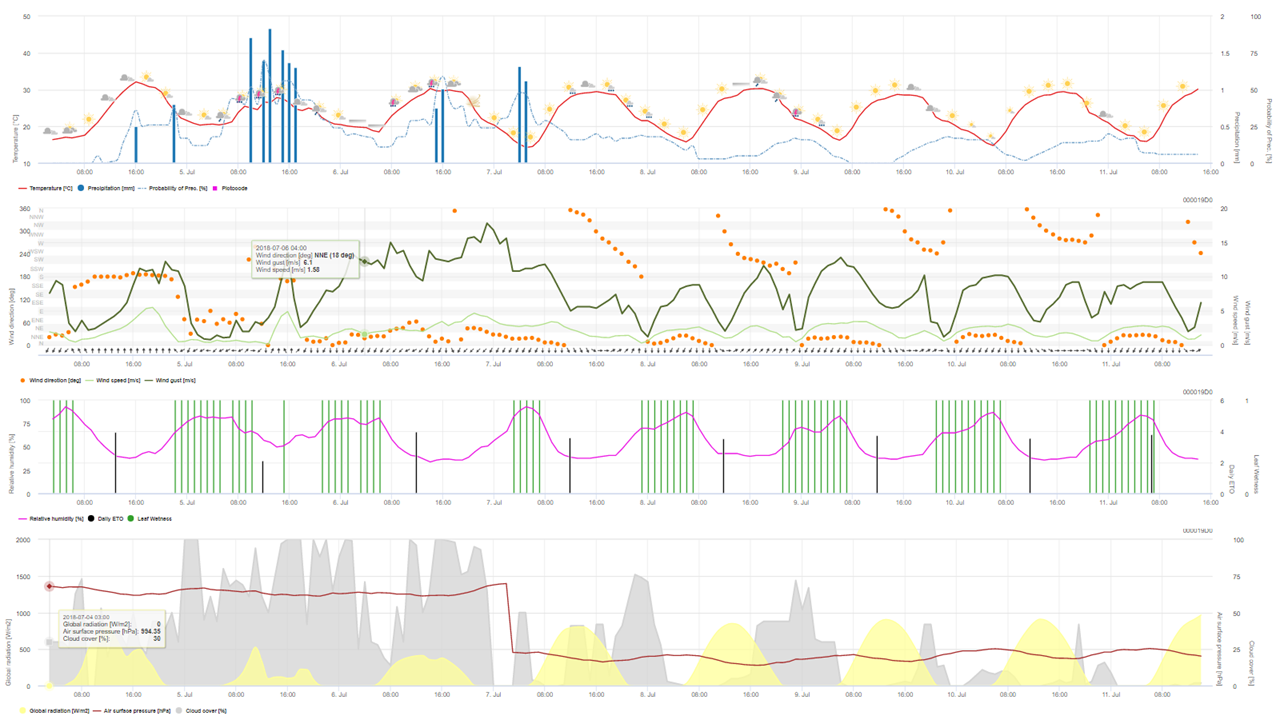 The wind direction in degrees is displayed by orange dots, while at the bottom an arrow helps you to understand the wind flow better. In the rectangle (tootlip) detailed data are available in all the graphs.
Note that ET0 is a daily calculation.
In the last chart, air pressure is at station altitude, while global solar radiation and total cloud cover refer to that portion of sky over the station.
Meteo One: a 7 days localised weather forecast with all meteorological data.
Meteo Agro: a 7 days localised weather forecast with agronomic information, plant protection window.
The wind direction in degrees is displayed by orange dots, while at the bottom an arrow helps you to understand the wind flow better. In the rectangle (tootlip) detailed data are available in all the graphs.
Note that ET0 is a daily calculation.
In the last chart, air pressure is at station altitude, while global solar radiation and total cloud cover refer to that portion of sky over the station.
Meteo One: a 7 days localised weather forecast with all meteorological data.
Meteo Agro: a 7 days localised weather forecast with agronomic information, plant protection window.
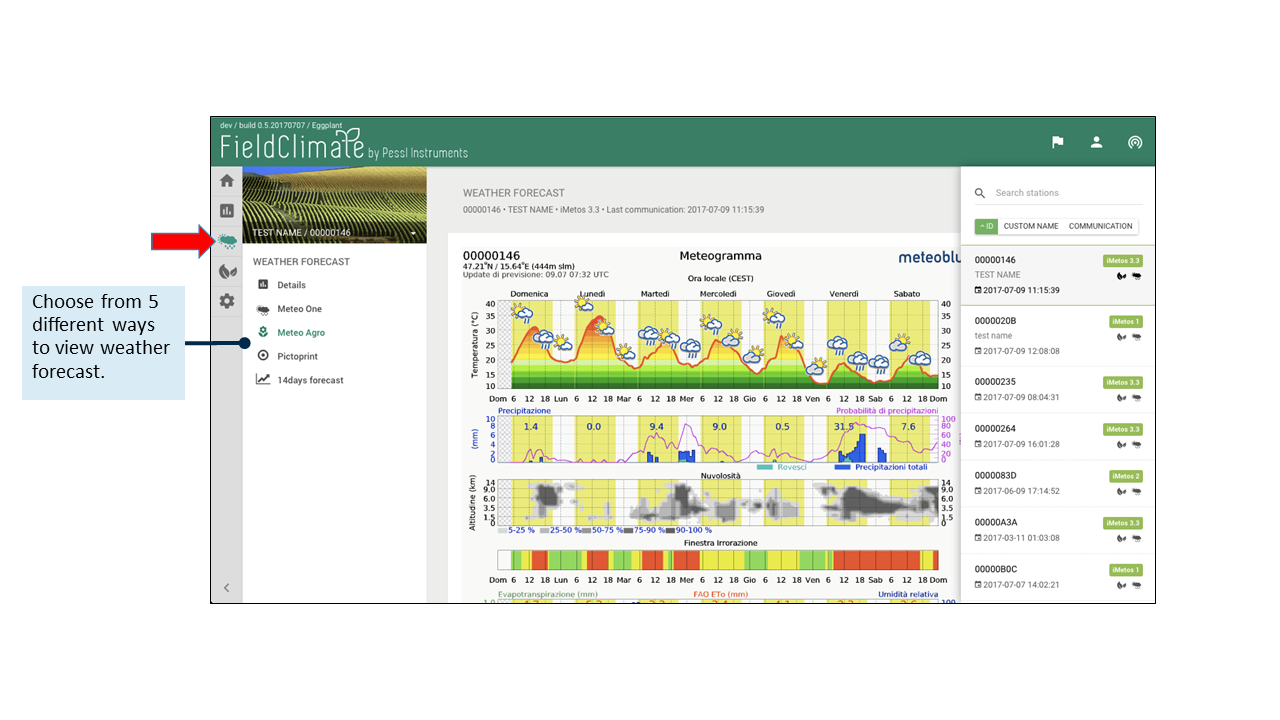 Pictoprint: a 7 days localised weather forecast with rainSPOT (15 km range).
14 days localised forecast.
Pictoprint: a 7 days localised weather forecast with rainSPOT (15 km range).
14 days localised forecast.
4.1 HISTORY & CLIMATE
Within this new page, there is now a broad scope of functionalities focused on historical weather data and climate data. Below you can find an overview of these features.4.1.1 RISK ASSESSMENT
The risk assessment diagram displays the probability of a specific weather event or risk to occur during a year. The diagrams are available for 1) cold, 2) warm events, and 3) precipitation, and are based on more than 30 years of historical simulation data. By comparing different years, you can reveal patterns of specific events. This diagram assists in weather dependent decisions such as outdoor activities, or sowing periods. The risk assessment diagram is subdivided into 3 parts:- Likelihood: The first diagram shows the likelihood of a certain event in percent (%). The y-axis indicates the likelihood, whilst the x-axis displays the time frame for all diagrams.
- Tolerable risk: The tolerable risk approximates the personal tolerable risk in percent (%). This enables the risk evaluation by taking into account divergences, which are personally acceptable. The y-axis indicates the tolerable risk in percent.
- Years: The third diagram compares the event occurrences of the last 40 years. The y-axis shows the different years. This helps to differentiate seasons and assists in evaluating the probability of a certain event.
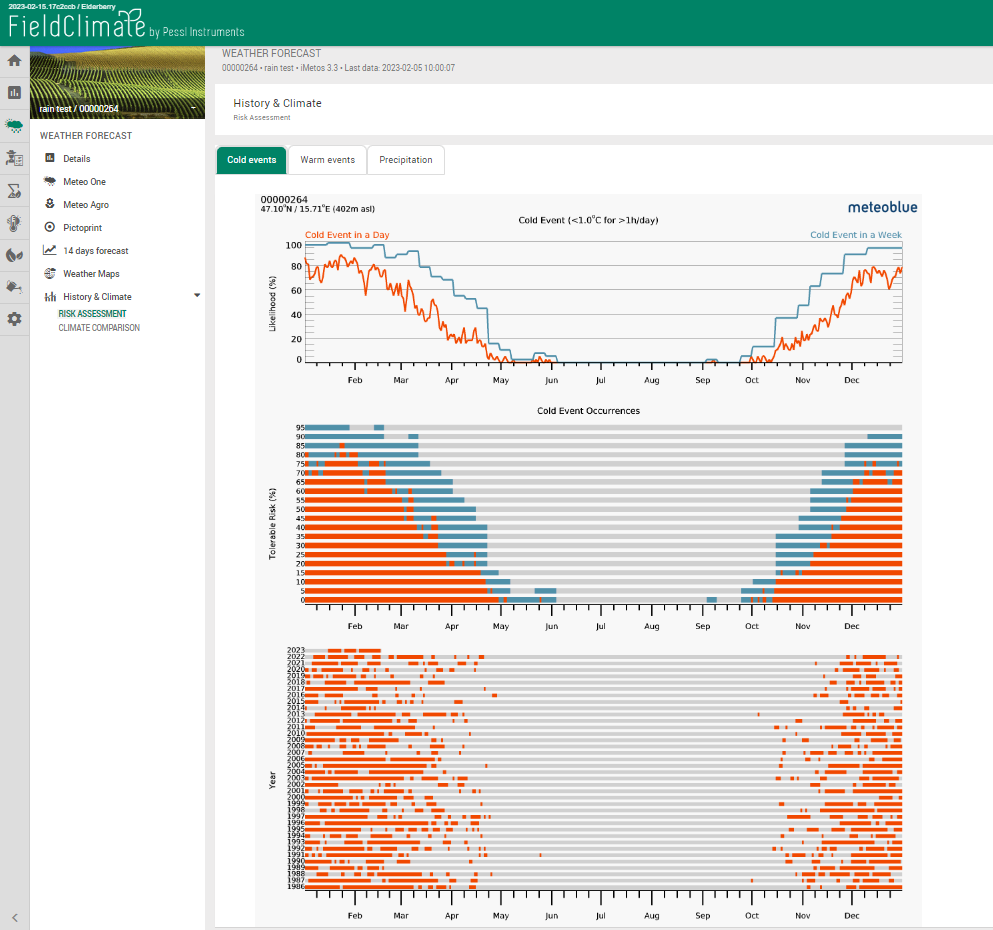
4.1.1.A COLD AND WARM EVENTS
Temperature is below or above a certain threshold for a certain time. The threshold is set for temperature values at 1°C for cold events while at 30°C for warm events. The cold events meteogram is commonly used to evaluate frost. The first diagram shows the likelihood of the defined event. You can estimate your personal risk in the second diagram. For instance, if your personal tolerable risk for a frost event is 20% you should schedule sowing later (e.g. end of April). On the other hand, if you can accept 50% frost likelihood in favor of earlier sowing, you should sow earlier (e.g. beginning of march).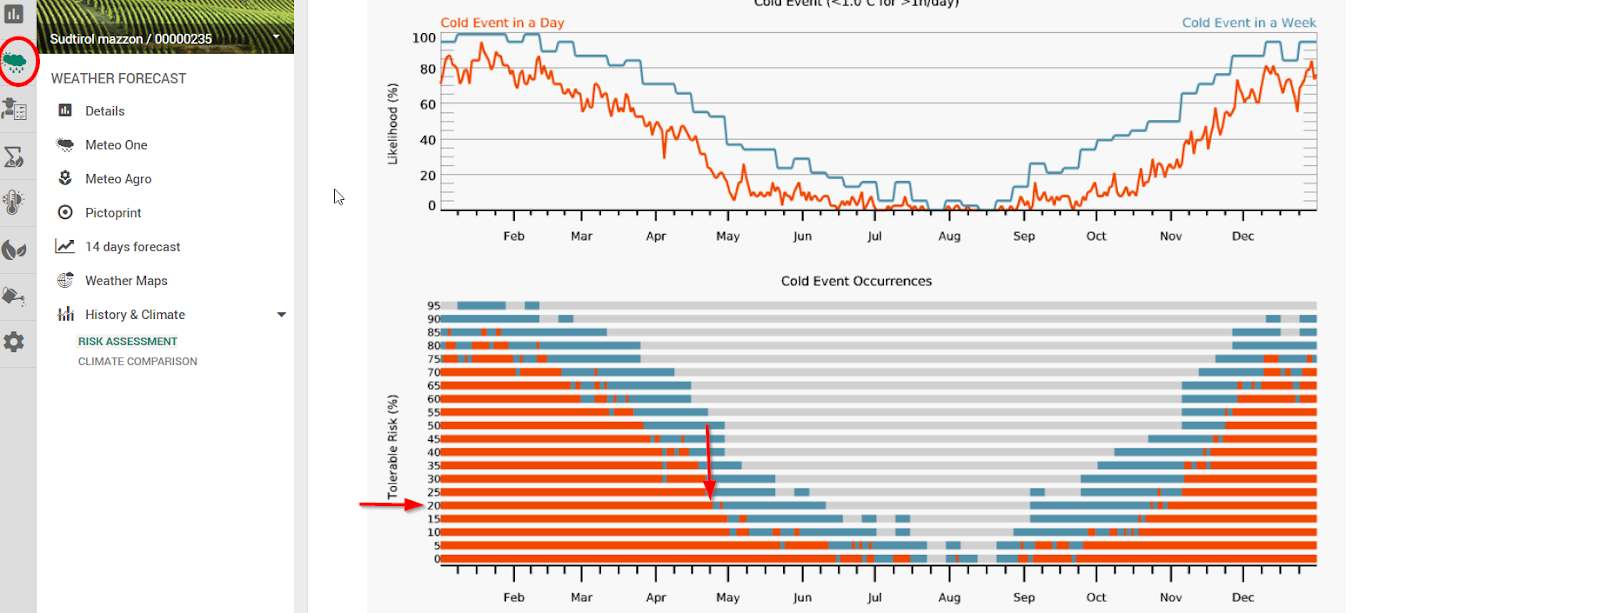
4.1.1.B PRECIPITATION
This variable evaluates precipitation amounts in a week above a certain threshold and with the help of this representation; you can estimate strong precipitation events and schedule activities accordingly. The threshold for precipitation amounts is set at 30 mm/week.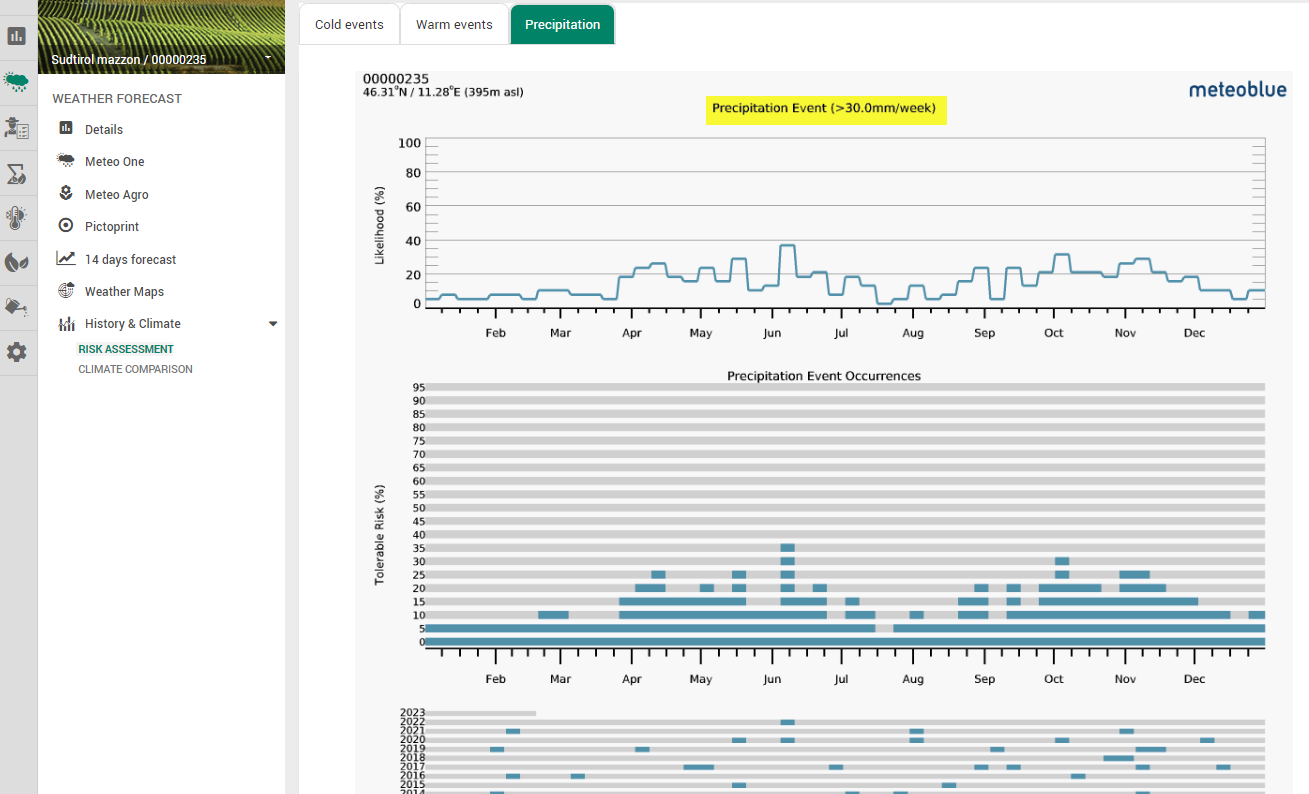
4.1.2 CLIMATE COMPARISON
4.1.2.A NEXT 6 DAYS METEOGRAM
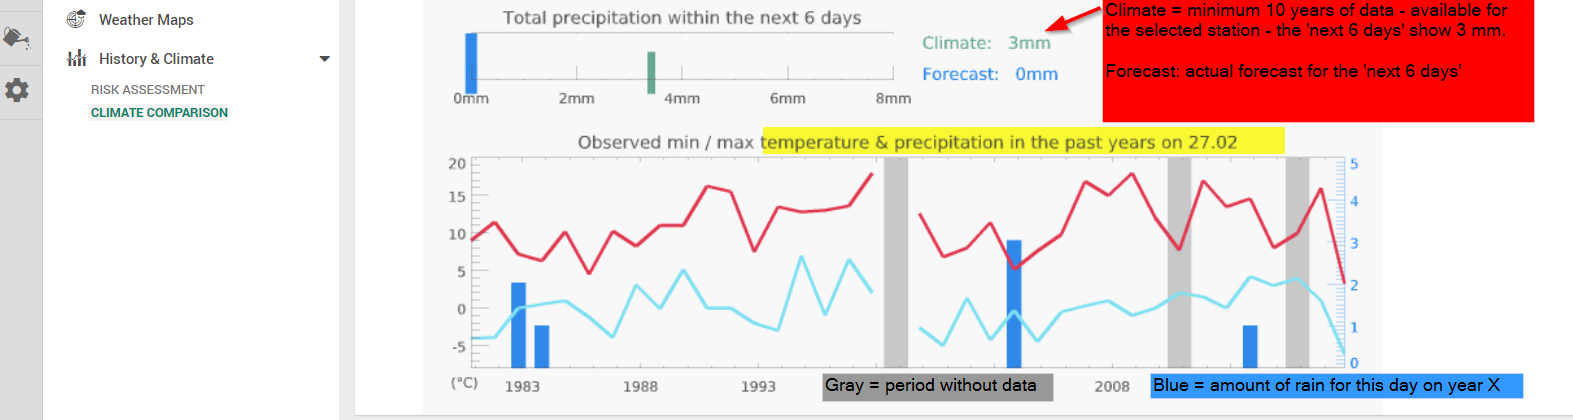
The meteogram Climate comparison shows the expected weather, compared to the weather of the previous 10 or more years. Thereby, you can see how “normal” the current weather is. The meteogram Climate comparison looks for the closest place which has a weather station with minimum 10 years of reliable measurements available. The name of the place with the station is indicated in the meteogram title, as well as the distance from the selected place. The temperature chart shows the range of maximum, mean (thin line) and minimum temperatures of the past years, and the forecast of the next 6 days (thick line). The total precipitation for the next few days is shown in the precipitation chart, relative to the average precipitation of the period during the last years.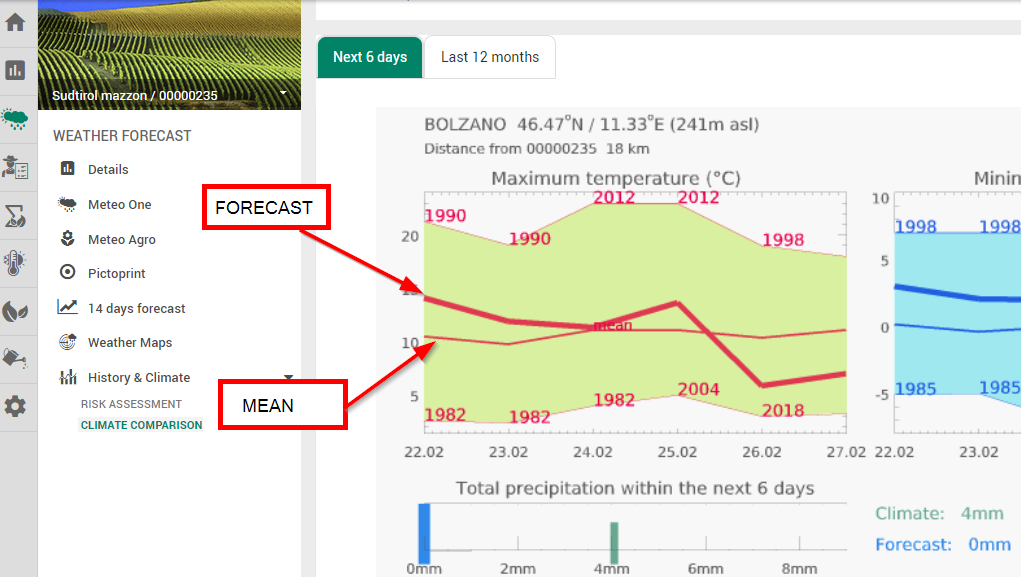 The climate chart shows temperature and precipitation of the current date as measured at the station on the same date during the past years. Years without measurement are marked with a gray bar.
For the climate chart, the nearest weather station, for which reliable measurements over 30 years are available, is selected automatically. In hilly areas, this station can be located at a different altitude than the selected place. Therefore the climatic diagram shows the measurement and the forecast for this station, and not for the selected place.
The climate chart shows temperature and precipitation of the current date as measured at the station on the same date during the past years. Years without measurement are marked with a gray bar.
For the climate chart, the nearest weather station, for which reliable measurements over 30 years are available, is selected automatically. In hilly areas, this station can be located at a different altitude than the selected place. Therefore the climatic diagram shows the measurement and the forecast for this station, and not for the selected place.
4.1.2.B NEXT 12 DAYS METEOGRAM – CURRENT TO CLIMATE
The “Last 12 months” meteogram enables a comparison of weather variables of the current season to the 30 year mean climate. This diagram shows the current season compared to the average climate for a chosen place. The diagram is labeled with temperature and months.- The black line shows the mean temperature for every month of the last 12 months (current).
- The thick orange line shows the calculated mean temperature of the last 30 years for every month (climate). This line denotes the exact mean of the temperatures but does not reveal fluctuations of the temperature from year to year.
- The orange buffer around the red line makes the fluctuations between the last 30 years more visible. It shows in what range the temperatures of the last 30 years are distributed. It shows the maximum monthly mean and the minimum monthly mean of the last 30 years.
- The wider the buffer around the red line, the more fluctuations between the years are common in this month.
- If the black line runs outside of the orange buffer, this means that the temperature of the current month or season does not correspond to the usual average temperature expected in this place.
- If the black line lies within the orange buffer, this means that the current temperatures fit the usual climate.
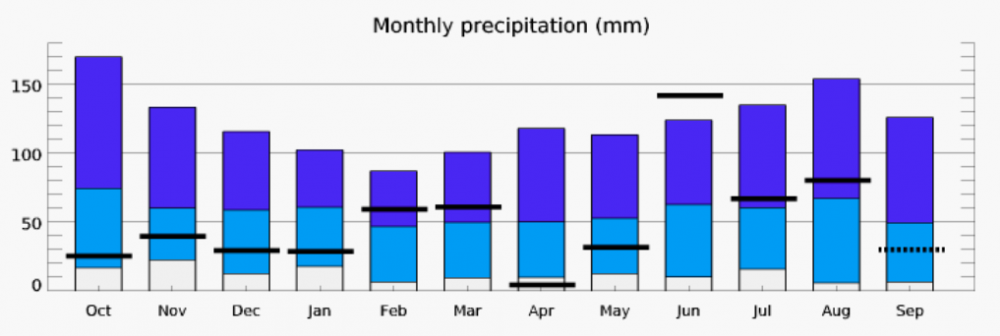 Monthly precipitation
The diagram for the monthly precipitation shows the amount of precipitation for each month of the last 12 months compared to the precipitation of the last 30 years. The graph is labeled with millimeters and months.
Monthly precipitation
The diagram for the monthly precipitation shows the amount of precipitation for each month of the last 12 months compared to the precipitation of the last 30 years. The graph is labeled with millimeters and months.
- The black-horizontal bars show the recorded precipitation for each current month.
- The dark blue bars show the maximum amount of precipitation during the last 30 years for each month.
- The light blue bars show the minimum amount of precipitation during the last 30 years.
- The white bars show the minimum amount of precipitation during the last 30 years.
- If a black bar is beneath the light blue bar or above the dark blue bar, this means that the current monthly sum of precipitation does not correspond to the 30 year average.
- The longer the blue bars, the greater the fluctuations of monthly precipitation are between the last 30 years.
- The shorter the blue bars, the less fluctuations there were in the last 30 years, which means that the amount of precipitation has been more constant.
5. WORK PLANNING PAGE
You will be able to access this page only if you have the Weather Forecast subscription activated. Pessl Instruments developed in the last 6 years a series of Work Planning algorithms based on the combination of real measurements of rain and temperature and the hourly 7-day weather forecasts. The work planning forecast based service information are available on hourly resolution for the next 7 days. The work planning algorithms indicate the most suitable (green colour) and the worst period (red colour), with more intervals in between, to perform and plan the requested operation in your specific field. Field accessibility and tillage ability are based on precipitation and show the better and worse periods to access and work the field. Fertilizing efficiency is calculated from wind gust, precipitation and relative humidity and shows in green colour the most suitable period to spread fertilizer. More information are available on the help content. Here below an example of the Fertilizing efficiency window in FieldClimate login. These services are all displayed in the first chart, while the second one shows the corresponding weather forecast.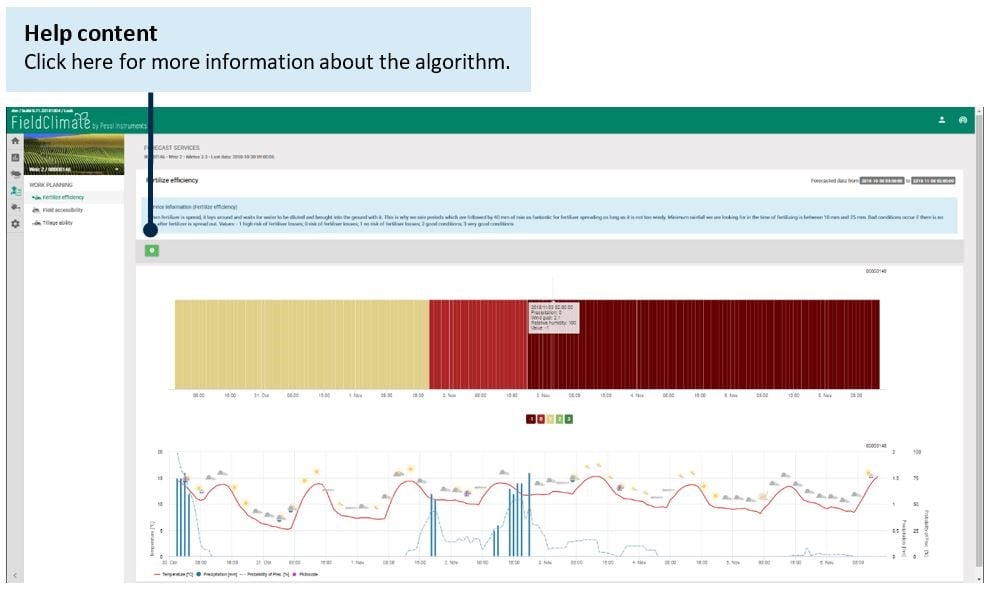
5.1 TROPICAL SOWING WINDOW
This model estimates the general sowing suitability for crops grown in a tropical environment. Measured rainfall, as well as the forecast of rainfall, and temperature are considered by the model. Suitable sowing periods will be marked green (score: 2). However, too high maximum temperatures in the forecast, overall low precipitation, or a forecast of extremely high hourly precipitation are unfavourable and are, therefore, marked as less suitable (yellow, 1) or unsuitable (red, 0) sowing conditions.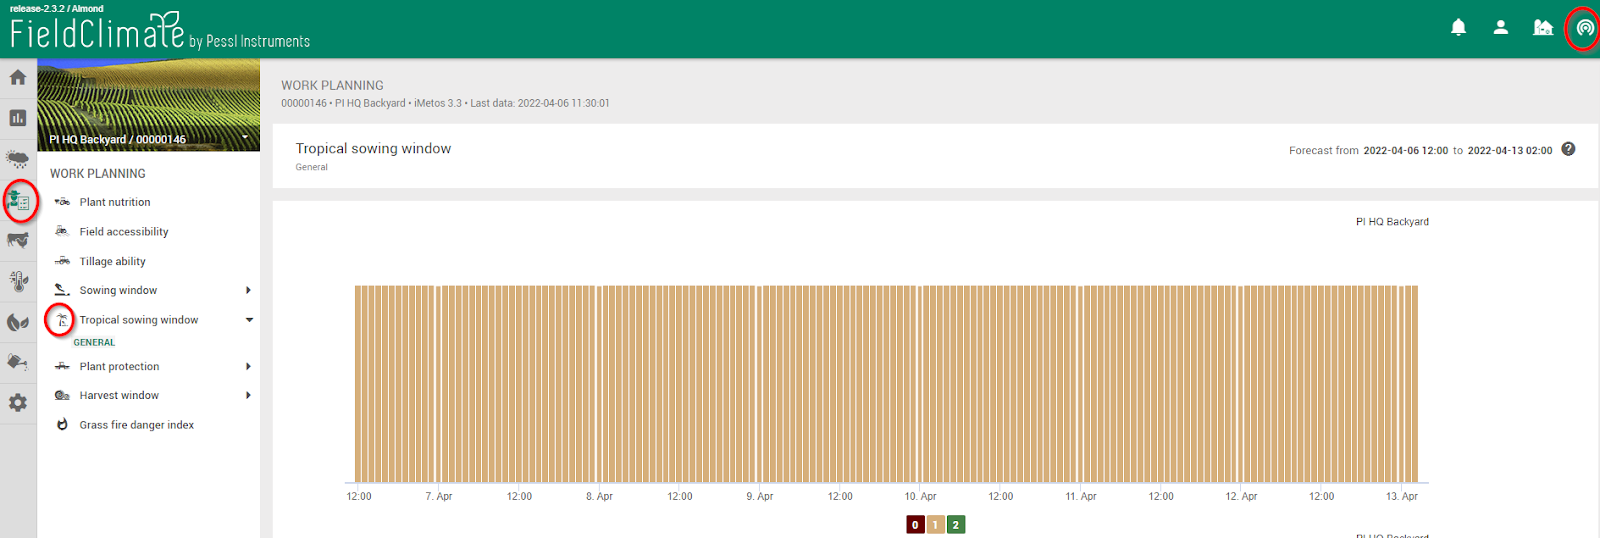
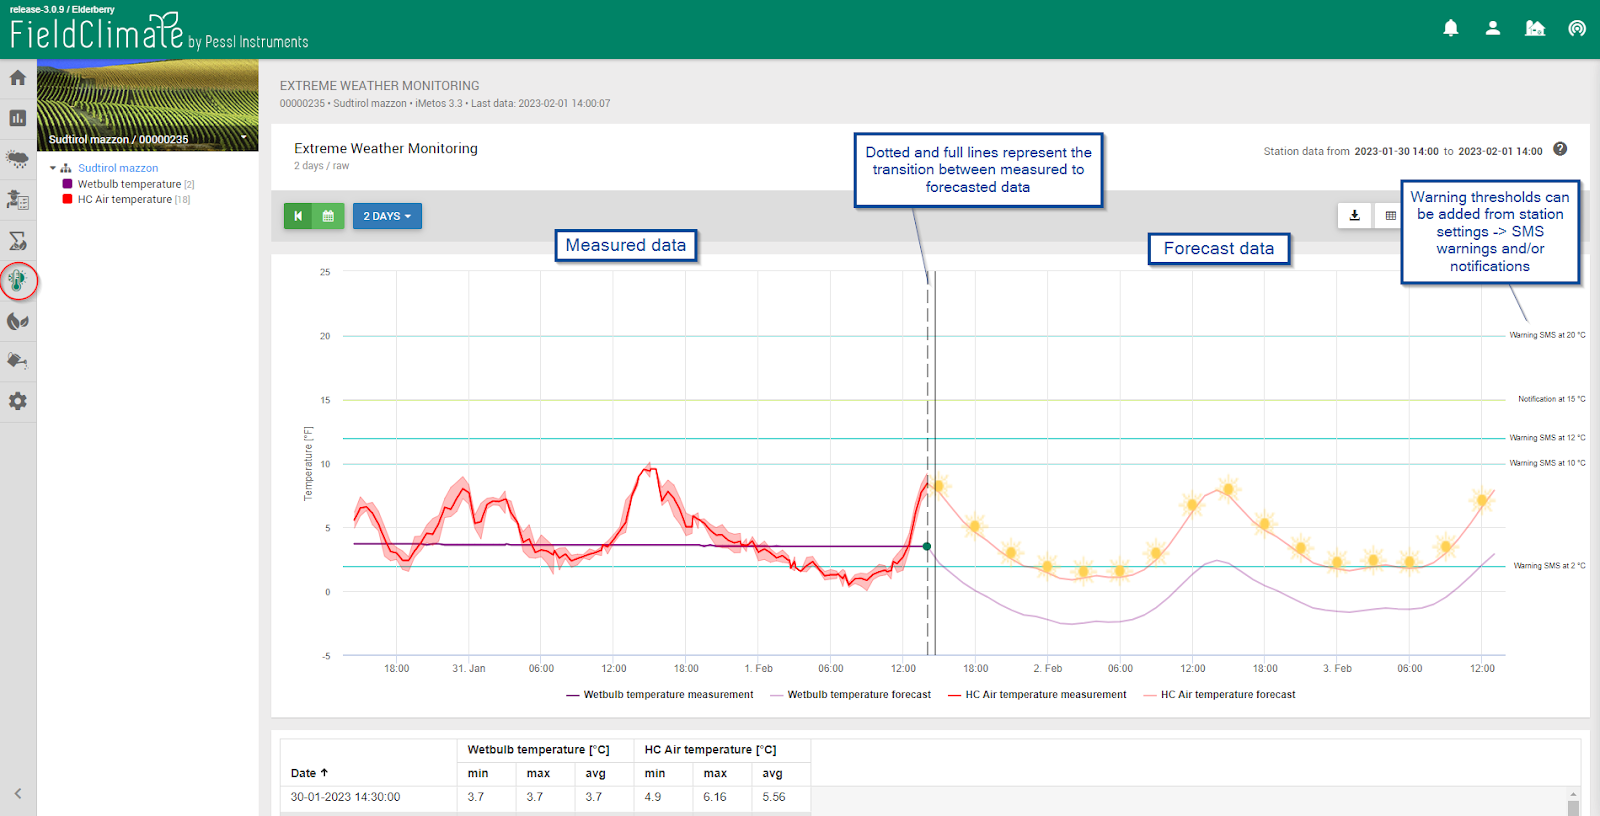
6. EXTREME WEATHER MONITORING PAGE
The Extreme Weather Monitoring page serves as a protective tool for frost and heating waves, keeping an eye over measured and forecast data on the same chart, allowing a quick assessment of the current situation, to identify risks and prevent damage to the crops and to the health of the population. The chart includes by default:- 48h past measured data of air temperature, wet & dry bulb temperature.
- 48h hyper localized forecast of air temperature and wet bulb temperature updated frequently with the latest data from your station, satellite and radar.
- Available for the sensors: wet bulb temperature, dry bulb temperature (only measured data) and air temperature.
 What is the role of Wet & Dry bulb temperature for frost protection?
Dry temperature sensor follows more accurately the plant temperature during clear nights, while the wet-bulb temperature can be used to estimate the potential for frost and to determine the best time to turn on sprinklers for frost protection.
What is the role of Wet & Dry bulb temperature for frost protection?
Dry temperature sensor follows more accurately the plant temperature during clear nights, while the wet-bulb temperature can be used to estimate the potential for frost and to determine the best time to turn on sprinklers for frost protection.
7. DISEASE MODELS PAGE
Once you chose the station, select your crop and the corresponding disease model. In the menu on the upper side, as explained in the Station Data chapter, choose the time lapse to show the chart/table. Then you can click on “Disease model information” to have more informations about the graphic of each disease. Graphs and tables show, for example, the disease risk (%), the infection progress (%) which are of key importance for the decision-making process for the farmer. Data is displayed hourly and you can select either the last period of time (from 24h to 30 days) or the time period from the calendar. You can also export data as image or csv, displaying it in a chart or table and at the end remember to refresh.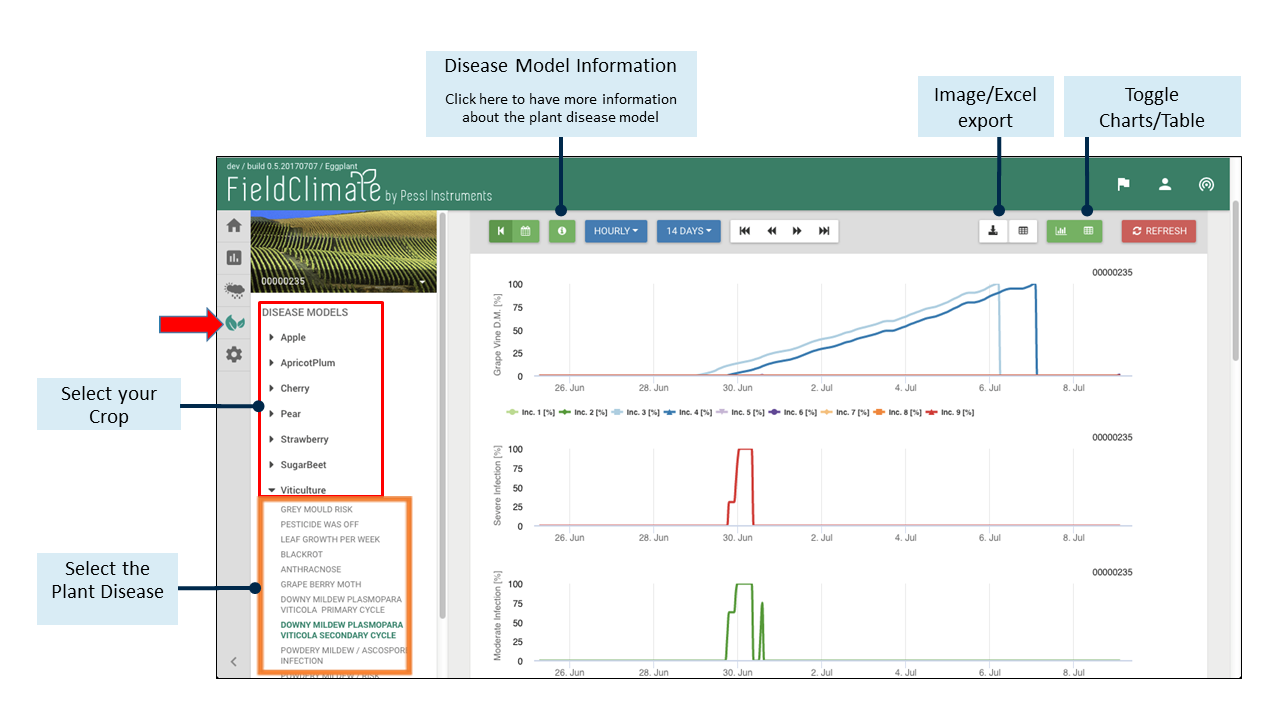 If you would like to learn more and have more detailed information about our Disease Support System visit this website.
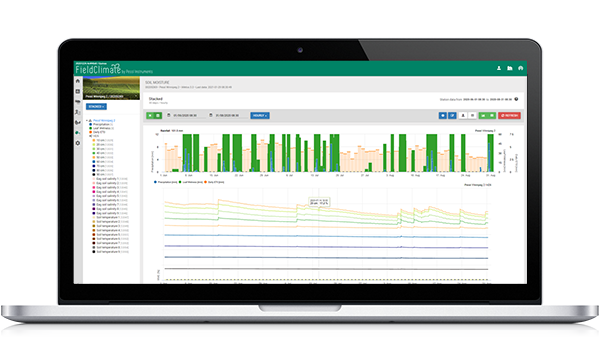
8. SOIL MOISTURE PAGE
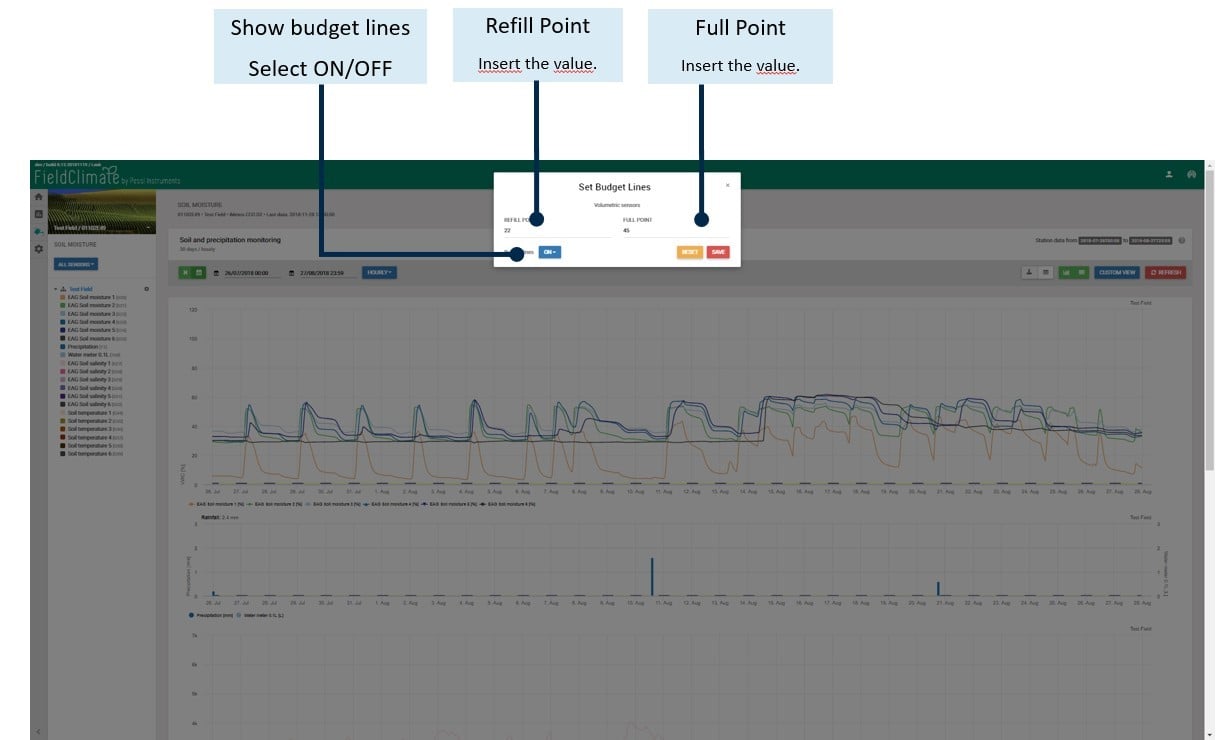
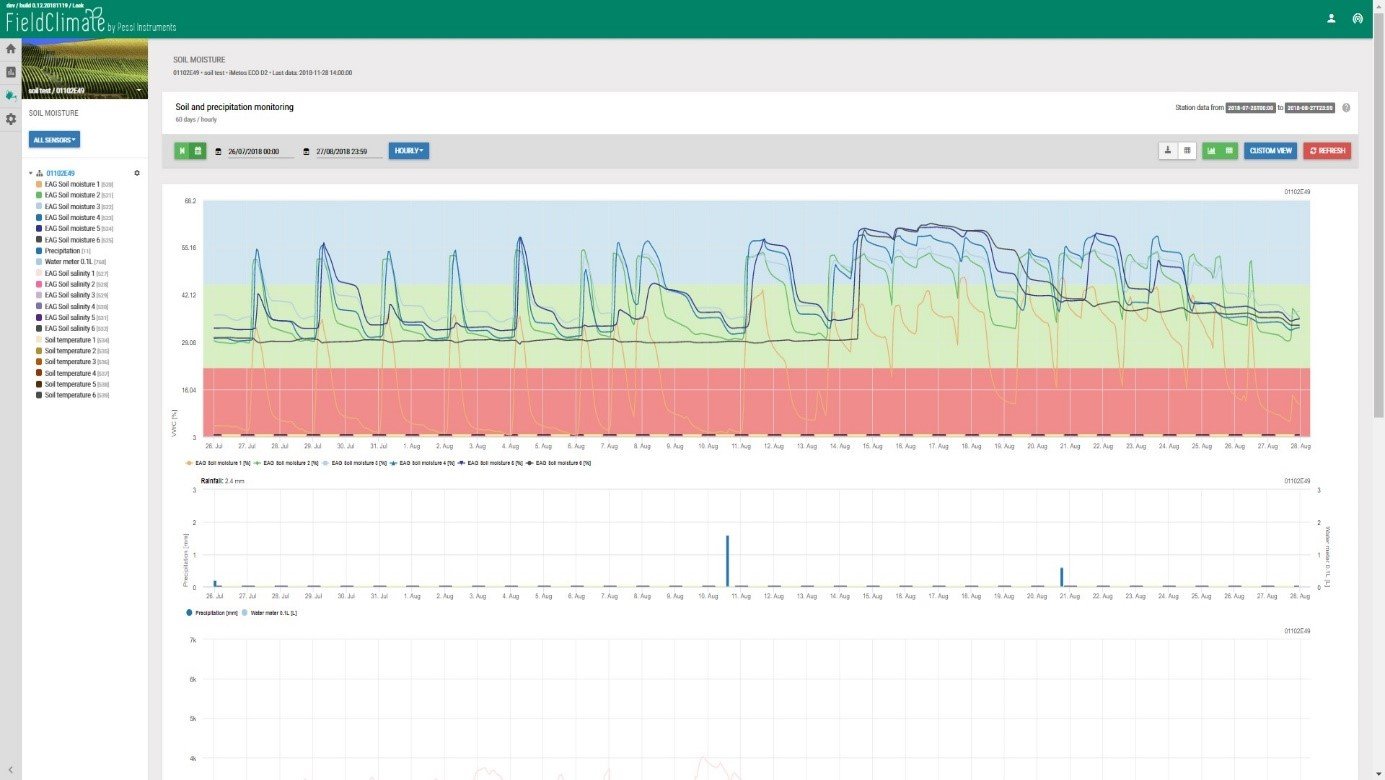
In this page you will find all your soil moisture sensors connected with your METOS® device which data are displayed in the charts. On the left side you will find all your sensors and you can select only the ones of your interest. In the upper menu you can choose the Time period for displaying your data, then remember to refresh. You can set the budget lines to apply the colored bands in the chart indicating different moisture conditions.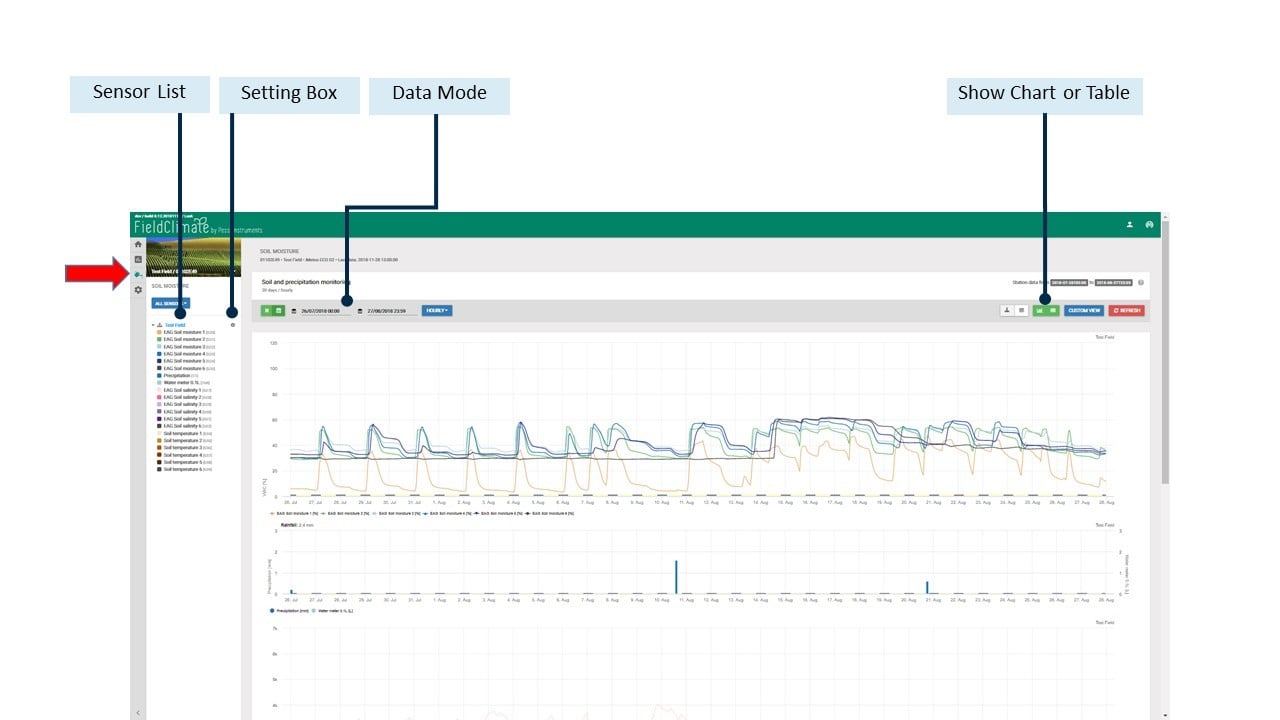 To access the settings box, you have to click on the settings icon in the left menu. Remember to select the option “Show bands”. You can set the Refill Point and the Full Point; be sure at the end to click “Save configuration” otherwise edits will be lost.
For different nodes you can configure settings separately.
To access the settings box, you have to click on the settings icon in the left menu. Remember to select the option “Show bands”. You can set the Refill Point and the Full Point; be sure at the end to click “Save configuration” otherwise edits will be lost.
For different nodes you can configure settings separately.
8.1 CUSTOM VIEW
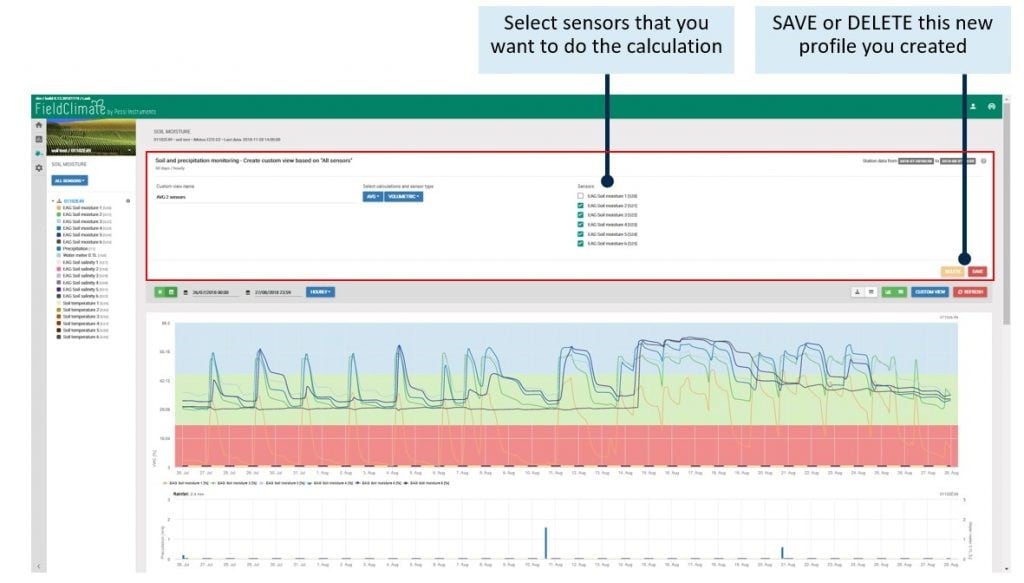
Click on “CUSTOM VIEW”; write a custom view name, select the type of calculation (AVG, SUM or PAW) and sensor (Volumetric or Tensiometric), and then select the sensors you want to do the calculation. Don’t forget to SAVE at the end.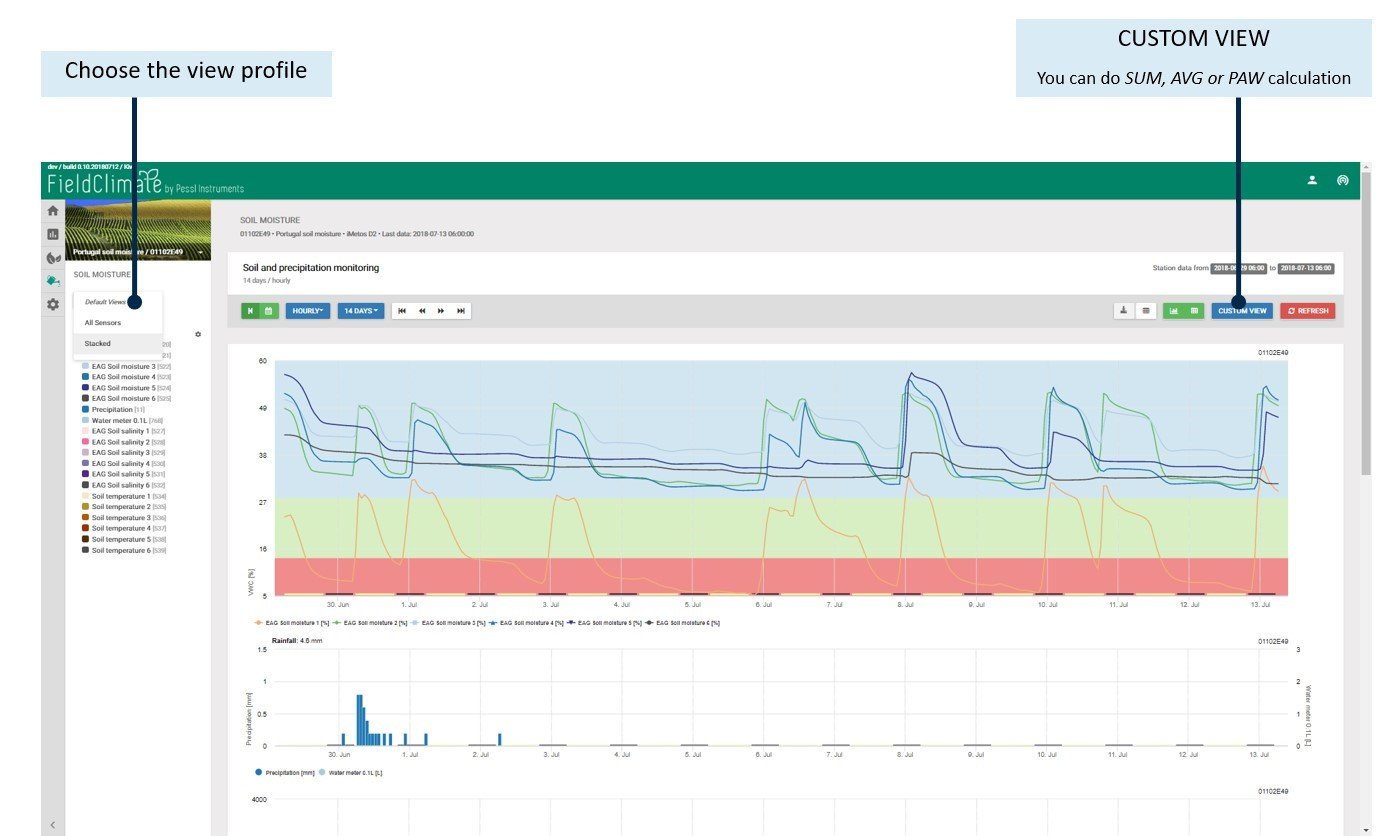
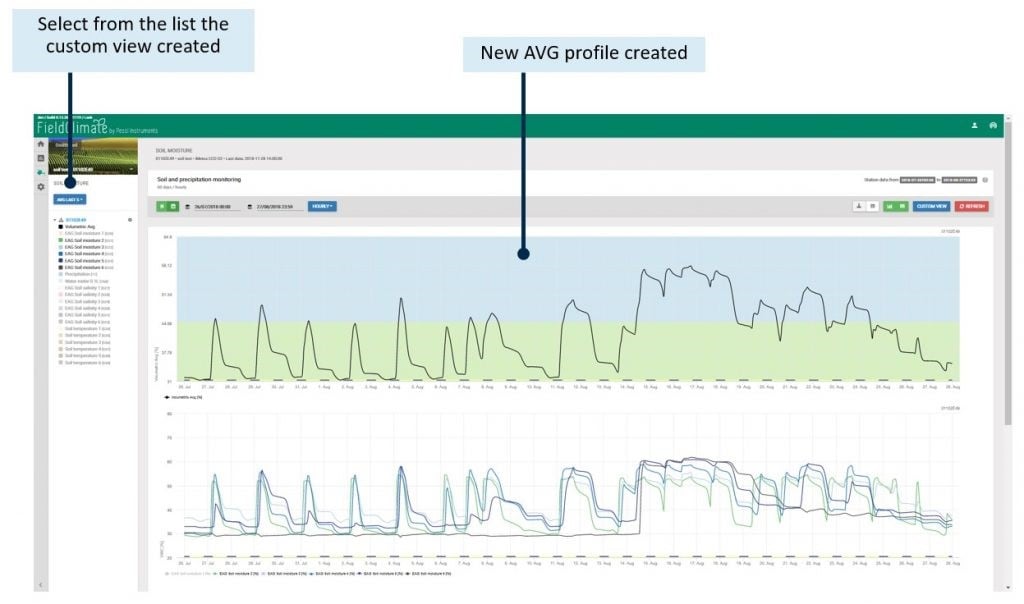
8.1.1 AVERAGE
8.1.2 SUM
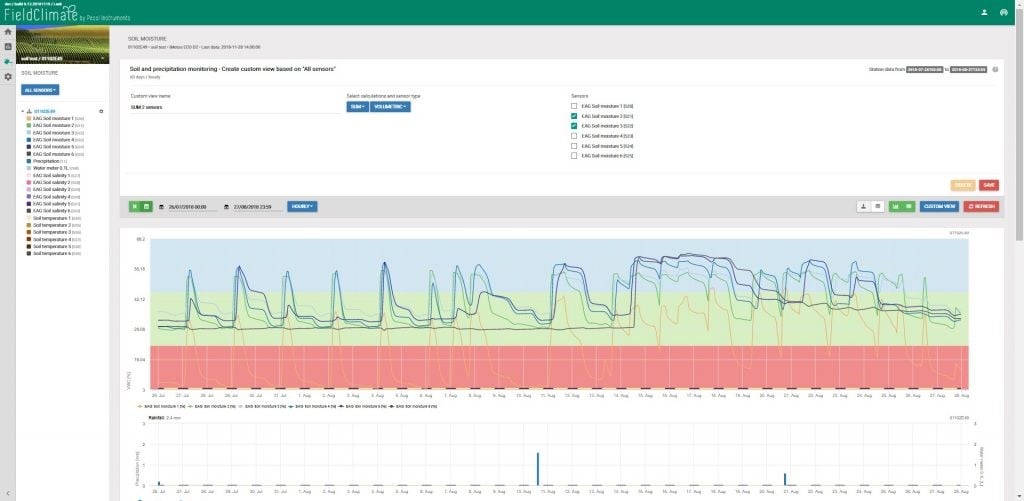
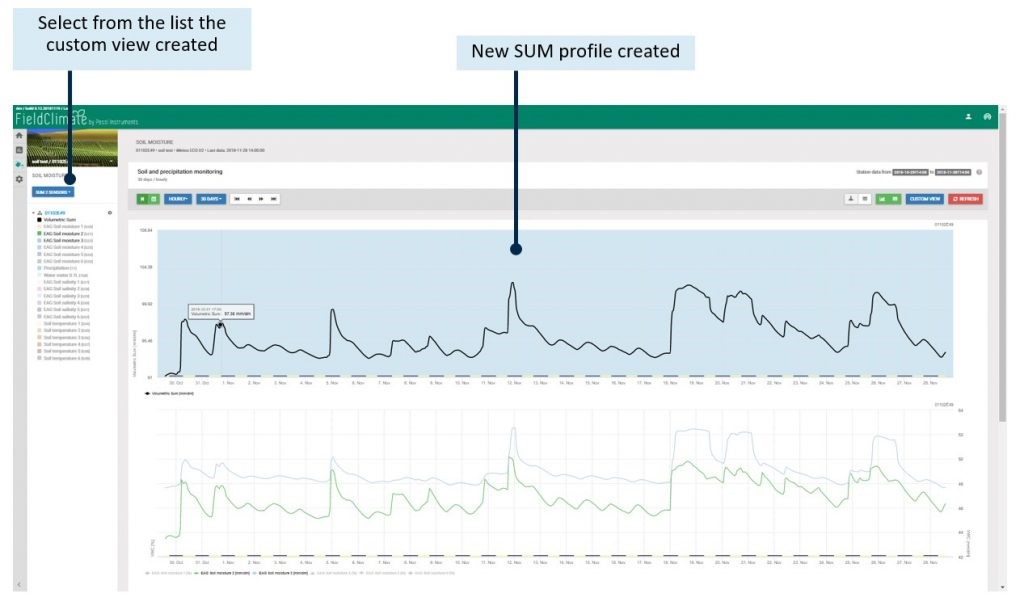 Note: when you calculate SUM for n sensors, Refill Point and Full Point values will be multiplied for n as well.
8.1.3 PAW
The PAW (Plant Available Water) calculation applies normalization to VWC data, based on WP (Wilting Point) and FC (Field Capacity) that you have to set in the related boxes for every sensor data serie. The calculated outputs are displayed for every sensor in terms of PAW, where 100% correspond to the Full Point (or Field Capacity), whereas the default value for Refill Point is set at 50%, but can be modified based on different crop water requirements. The Budget Lines defined the colored bands (red, green, blue) are referred in this case to the Full Point fixed at 100% and the Refill Point set in the Custom View Box.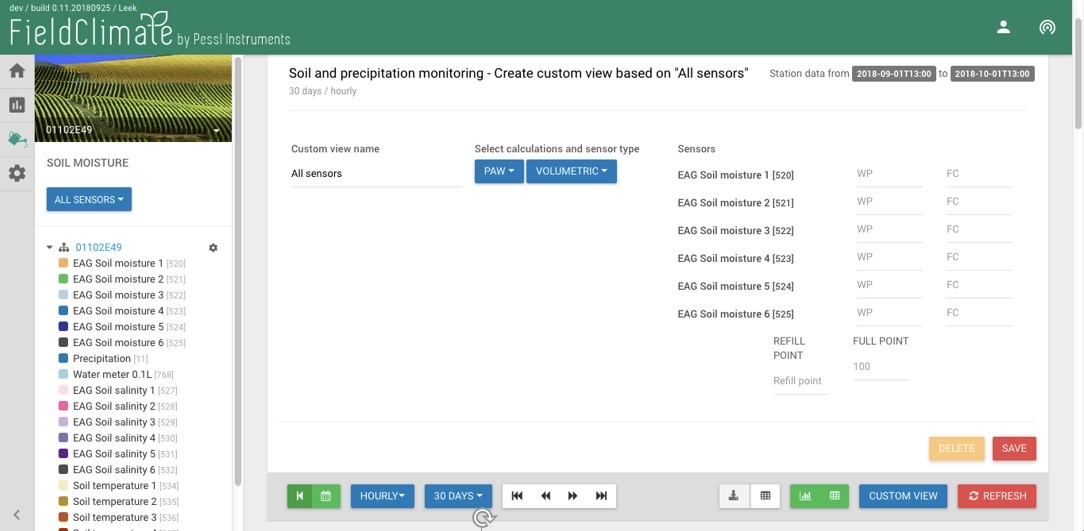
8.2 SOIL TEXTURE CALIBRATION
For some soil moisture profile probes additional column CALIBRATION is available in Settings -> Sensors and nodes, where you can select different soil texture calibration equations to be applied to your soil moisture data. The texture calibration options available are the official ones provided by the OEM probe manufacturers.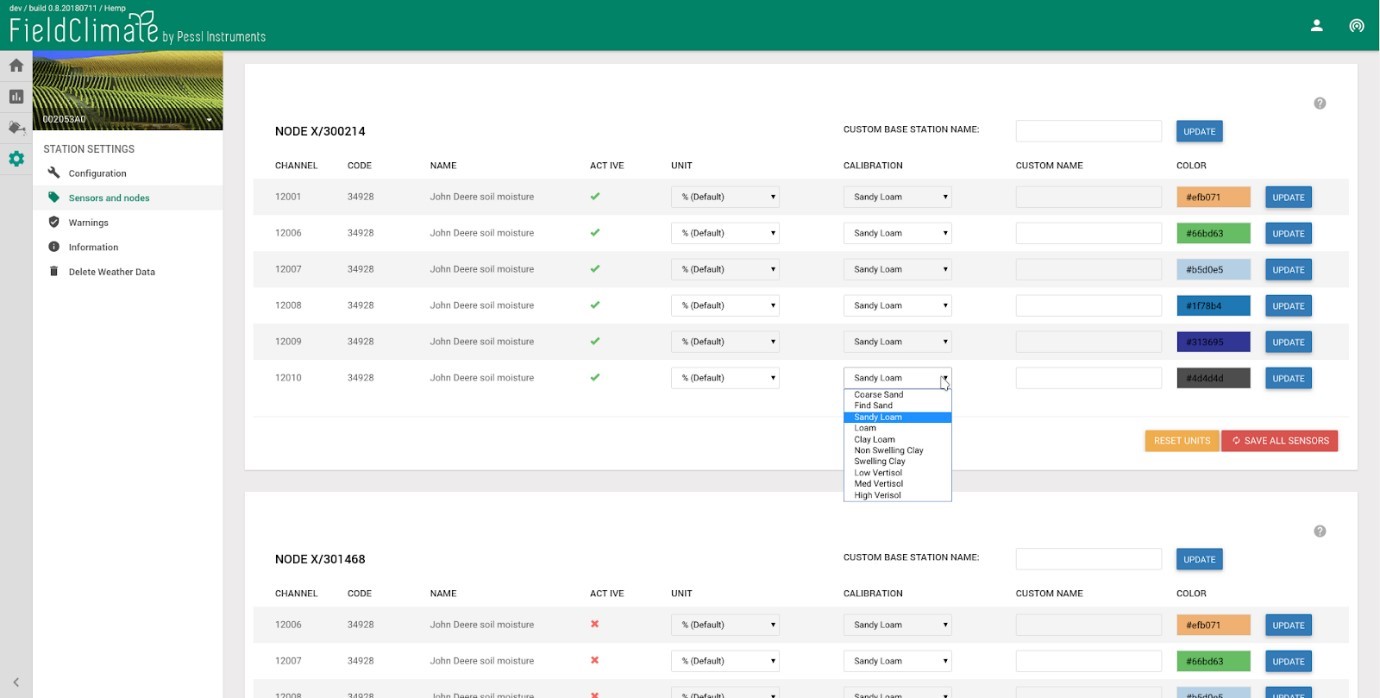 Here below is an example of soil texture calibration on an METOS® DDT probe.
 The RAW value coming from the station is VWC with applied Sentek Default calibration.
The different soil texture calibrations equations follow the following form:
VWC= ((SF-c)/a)^(1/b); where VWC is Volumetric Water Content, SF is Scaled Frequency and the coefficients a,b,c depend on the soil texture as indicated in Table 1.
The RAW value coming from the station is VWC with applied Sentek Default calibration.
The different soil texture calibrations equations follow the following form:
VWC= ((SF-c)/a)^(1/b); where VWC is Volumetric Water Content, SF is Scaled Frequency and the coefficients a,b,c depend on the soil texture as indicated in Table 1.
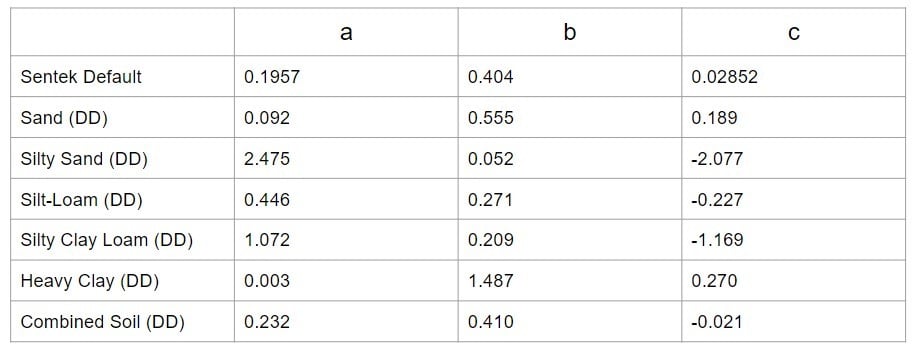 Table 1 – Coefficients of different soil texture calibration equations.
9. CropVIEW®PAGE
It needs to have an CropVIEW® device in your crop. It is an agricultural information system that periodically takes high resolution photos of the crop. Photos are automatically uploaded to the FieldClimate platform and allows continuous crop monitoring and yield control. High resolution images can be analyzed over time in relation to environmental data. To access the CropVIEW® page, please click on eye icon on the left side of the bar. After clicking on the eye icon, a new page with full-scale picture will open. Below the full-scale picture, you can find a date selection option and a selection between the two cameras – wide angle lens and zoom lens. With this you can choose which picture to show in full-scale.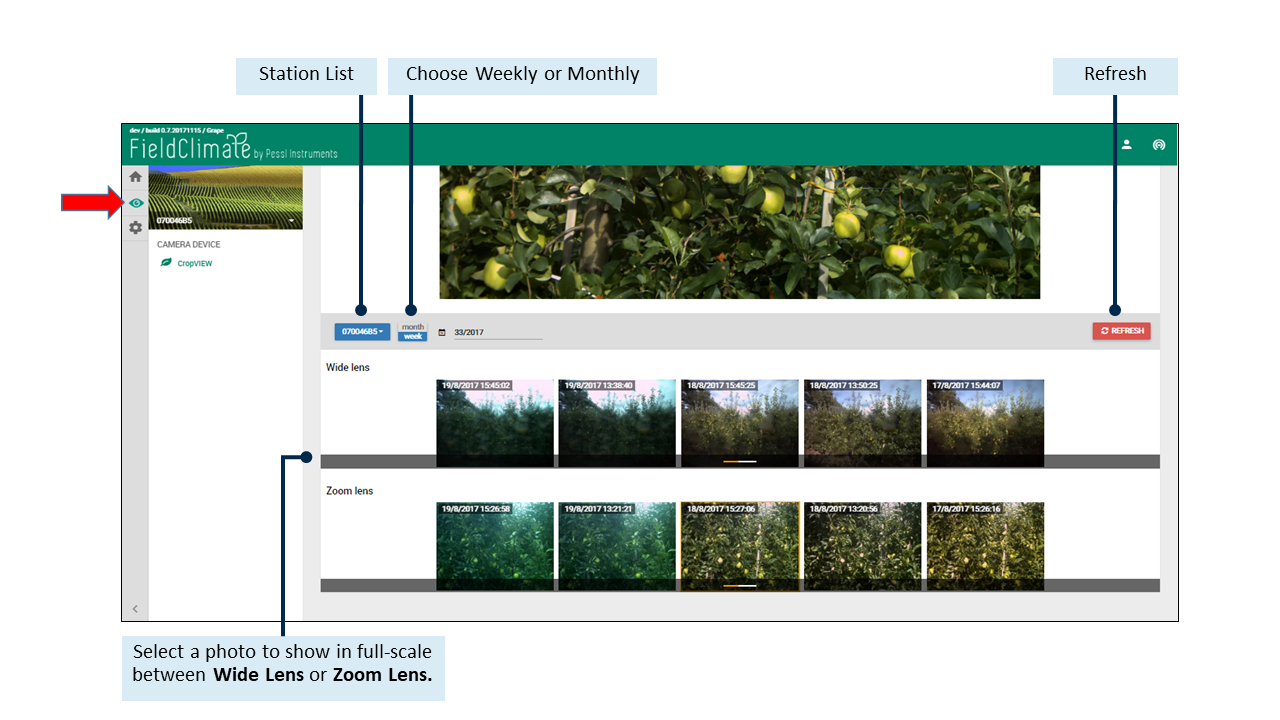
9.1 FRUIT DIAMETER TOOL
A new tool is implemented in FieldClimate, which allows you to manually draw circles around fruits, on pictures taken from your orchard or field by CropVIEW® device. If you precisely know the distance between the camera and crop, you will also get a reliable measurement of fruit diameter in mm (depends on the distance between camera and crop – more precise it is, more precise will be the measurement). To start using this tool, you must select a picture from zoom camera and click on the “Start Drawing” button on the top of the high resolution picture. Click on the help button (?) next to “Start Drawing” and follow the instructions.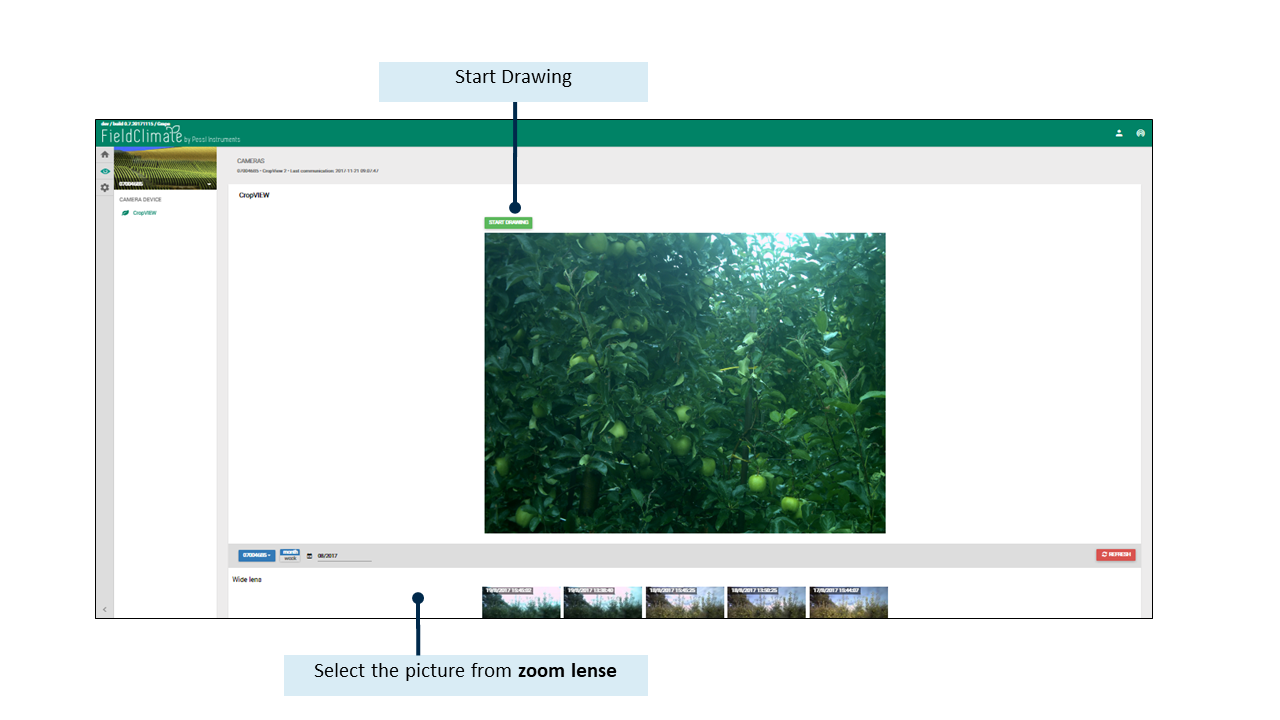 To start drawing on the image, hold SHIFT and LEFT MOUSE button, then move the mouse to draw the circle. Once you release the mouse button the circle will be drawn and fixed on the image. Hovering over the circle with your mouse will color the circle in blue. You can simply select that circle with a left mouse button click. Once the circle is selected, move it around with your mouse while holding down the left mouse button. To edit the circle simply hold down the CTRL key on your keyboard and the left mouse button, then move the mouse to the left if you wish to make the circle smaller, or to the right if you want to make the circle bigger. To discard a circle, select it first by clicking on the circle you wish to remove, then press the DELETE button on your keyboard. To stop drawing click the “Stop drawing” button below.
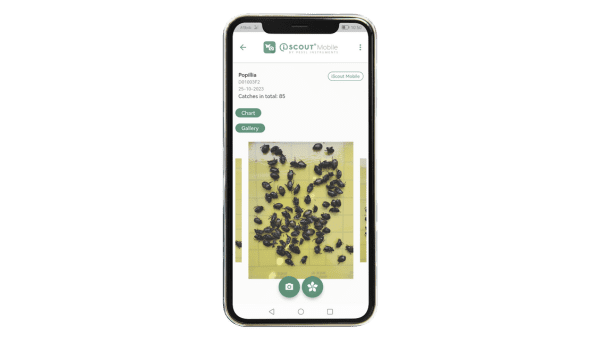
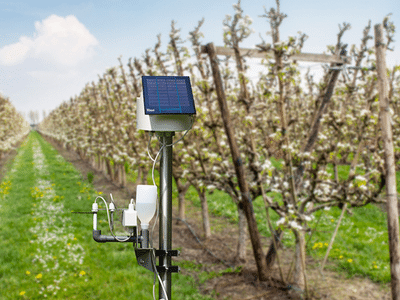
10. iSCOUT® PAGE
iSCOUT®, a combination of hardware and software with the aim to remote monitor agricultural pest insects. With its integrated electronics and sticky plate, it is smart enough to be hung where needed. In the field, the device is self-sufficient, being powered by a solar panel and a battery. Integrated camera takes high-resolution pictures of the sticky plate within the iSCOUT. Images are sent via LTE/UMTS to the FieldClimate platform where they are analysed with ML methods. The results are then visible on the web and mobile devices. Those real time data can be used for further analysis and support you timely with your decisions. The iSCOUT® page in FieldClimate is accessible when clicking on the EYE icon on the left side of the bar. After clicking on the eye icon, a new page with the pictures of your device will open. In the Gallery we show all pictures per month, week, season (you can use the drop-down list to change). Important: click refresh after choosing an option. If you want to see previous months/weeks/seasons use the buttons for moving back or forward.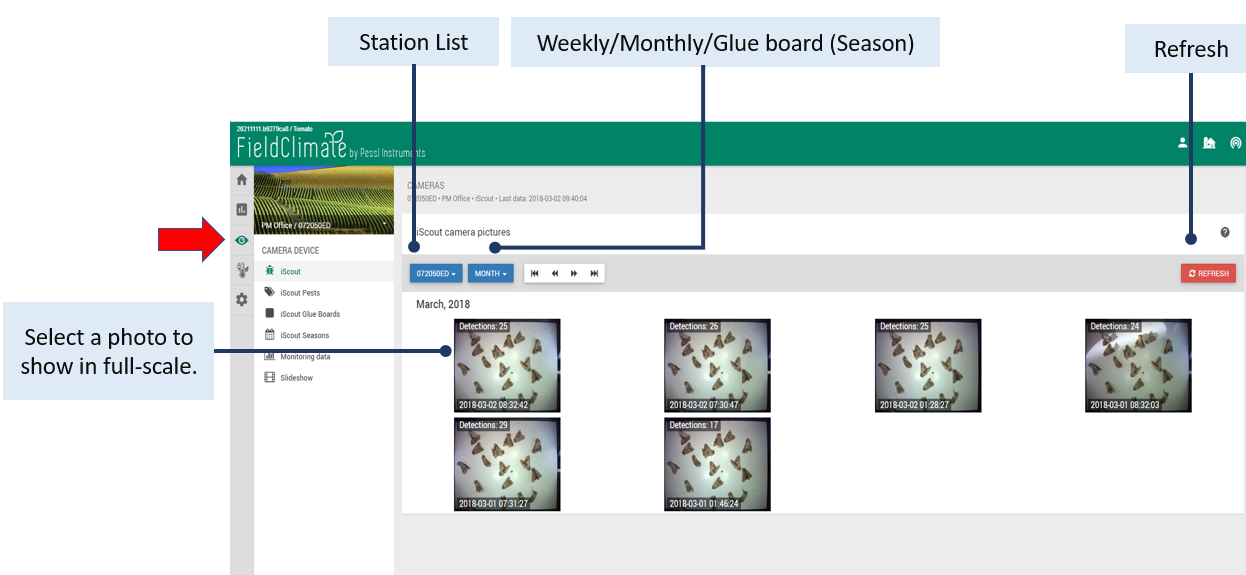
10.1 INSECT DETECTION TOOL
When clicking on a picture the “correction mode” with automatic insect detections, drawn as green rectangles around the insect are shown. Thicker rectangles mark the new insects the system detected, based on the previous image. You can rename the drawn rectangles on the image. Select the rectangle, click on the right mouse button and label/mark the insect according to the default pest insect list or create your own pest list. The detections will be tracked back and forward, so they exist as long as the insect stays in that position. You are also able to draw rectangles manually and name them, however they just stay at the photo the drawing has been made. Remember to SAVE changes. If you want to hide insects that are not in your interest, you can do so by clicking on their name in the right upper corner- detection results and they get inactive (greyish). You can also export the image.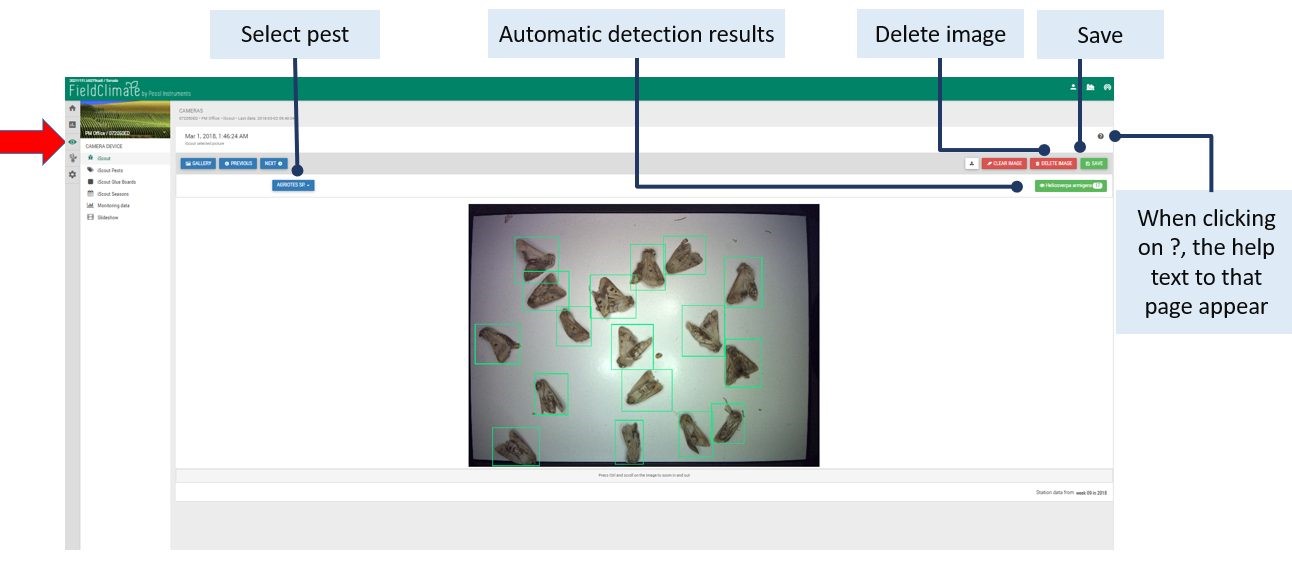
10.2 iSCOUT® PESTS
Per default a list of various agricultural insect pests is available. However, you are able to deactivate the visibility of that pest list (click NO on the question “Display system defined pests?”) and create your own pest list with ADD PEST.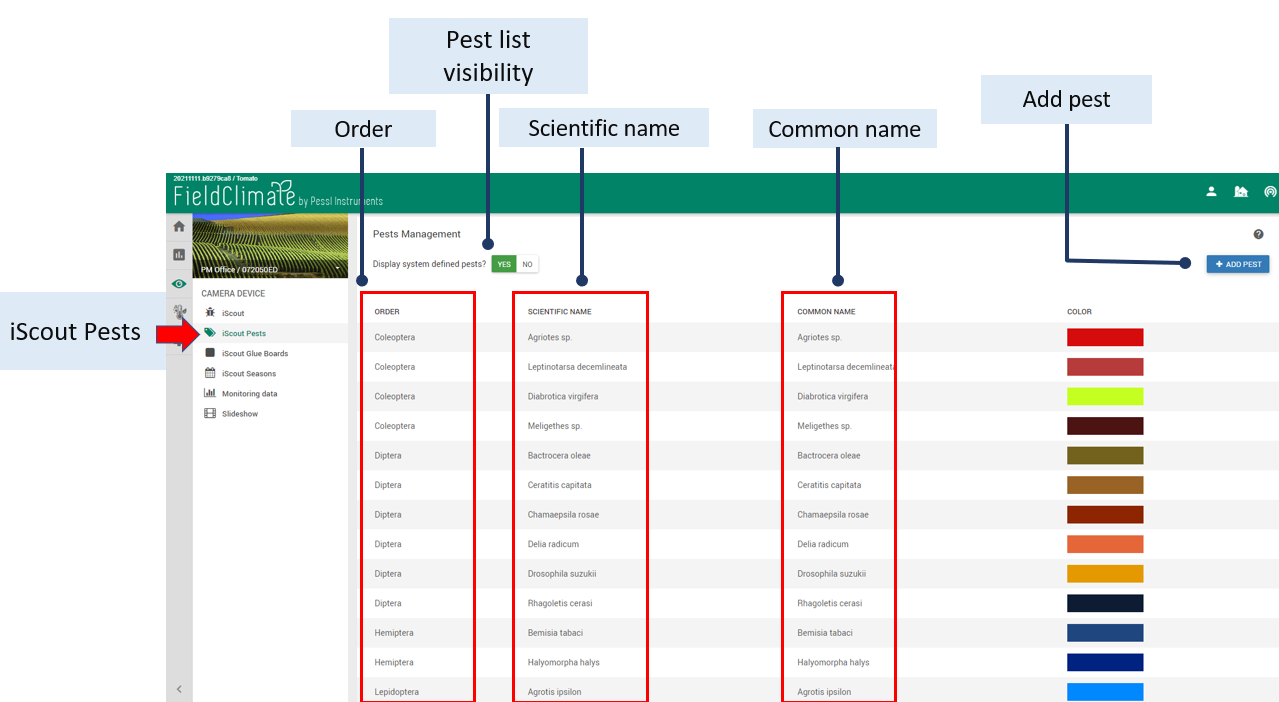
10.2.1 ADD A NEW PEST
Here it is obligatory to choose the order of the pest insect, on all other fields you can freely choose the names. That new added pest insect will appear on the pest list and in the correction model to be selected to label on the photo. Remember to SAVE changes.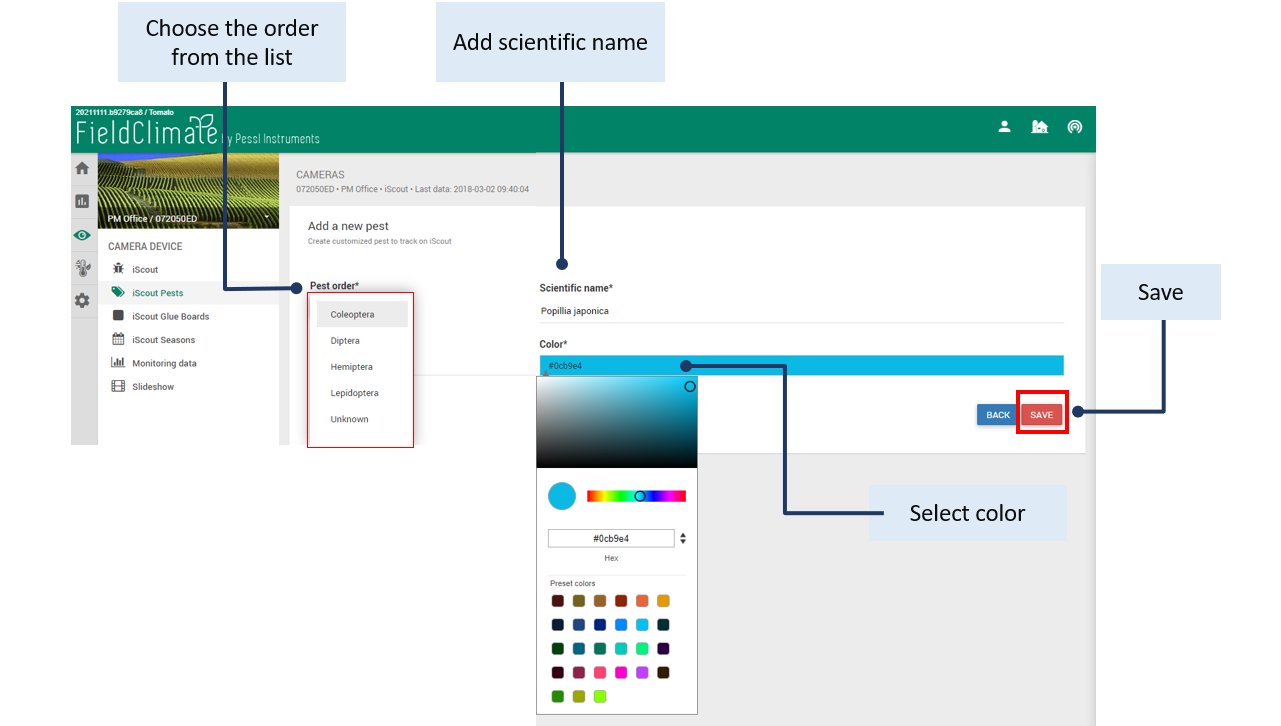
10.3 iSCOUT® GLUE BOARDS
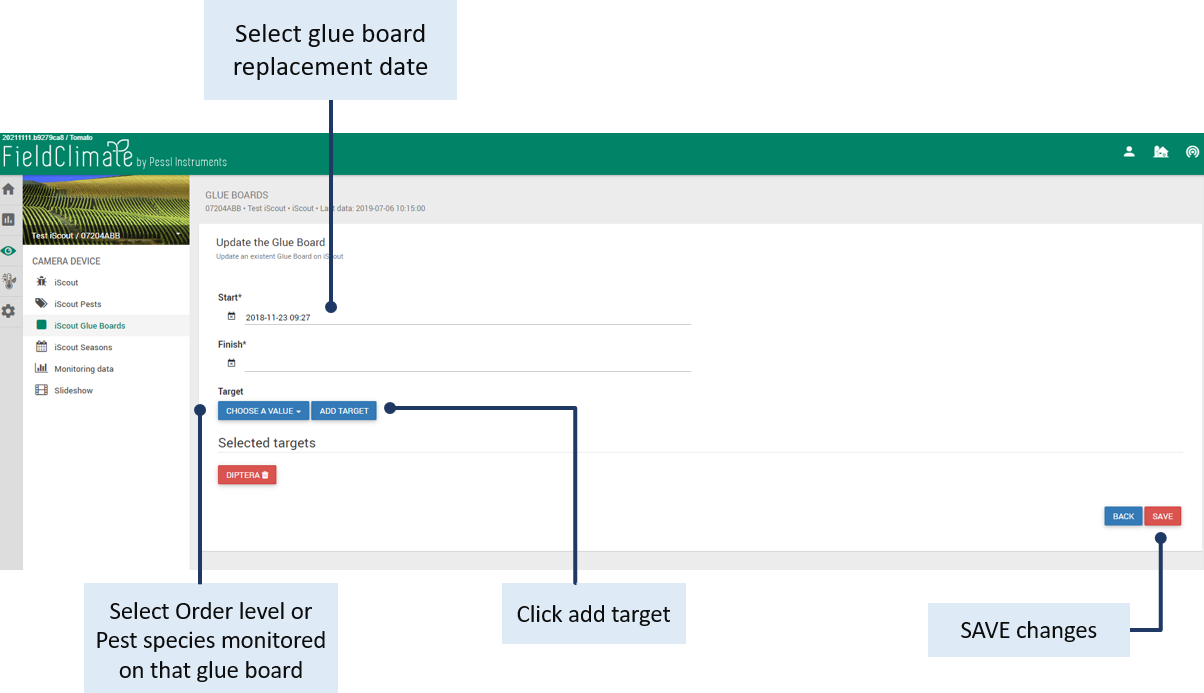
iSCOUT® glue boards help you to manage your pest-monitoring season.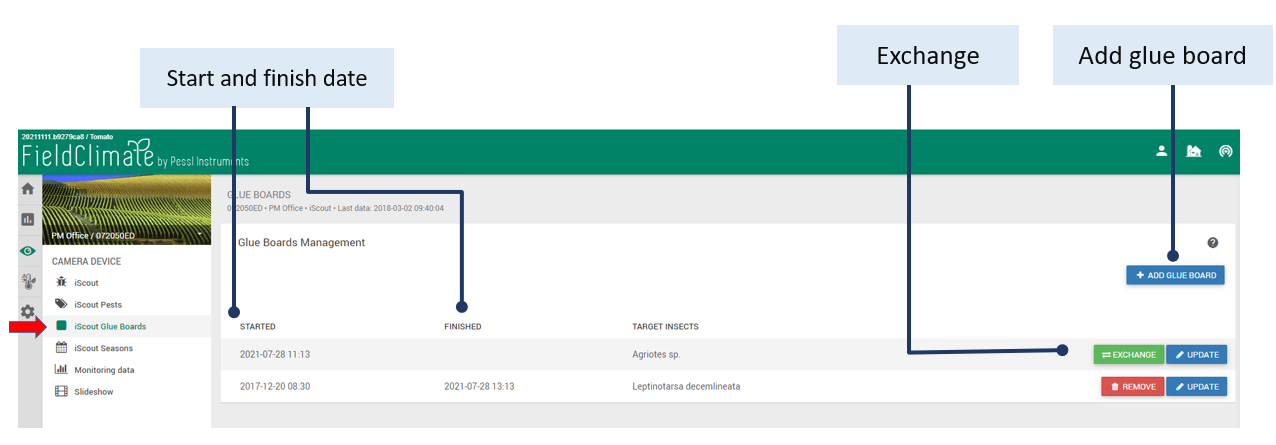 “ADD GLUE BOARD” option allows you to define when the glue board was replaced and when you replaced it with a new one. You can also define the pest insect list (on order or species level) monitored on that glue board by clicking “ADD TARGET”. Using that function and adding specific target insects on the glue board page will influence your detection page with the photos, only those insects that are added to target and are of interest, will be seen and followed on your photos. All the others are handled as “not interested insects” and are hidden automatically.
Be sure to click the “SAVE” button after making any changes, otherwise edits will be lost.
“ADD GLUE BOARD” option allows you to define when the glue board was replaced and when you replaced it with a new one. You can also define the pest insect list (on order or species level) monitored on that glue board by clicking “ADD TARGET”. Using that function and adding specific target insects on the glue board page will influence your detection page with the photos, only those insects that are added to target and are of interest, will be seen and followed on your photos. All the others are handled as “not interested insects” and are hidden automatically.
Be sure to click the “SAVE” button after making any changes, otherwise edits will be lost.
10.4 iSCOUT SEASONS MANAGEMENT
Glue boards are summarized into seasons. Click “ADD SEASON” to organize photos per season. Be sure to click the “SAVE” button after making any changes, otherwise edits will be lost. The “GLUE BOARDS” button allows you to see information about glue board (date, insect counts). You can also remove or update seasons info.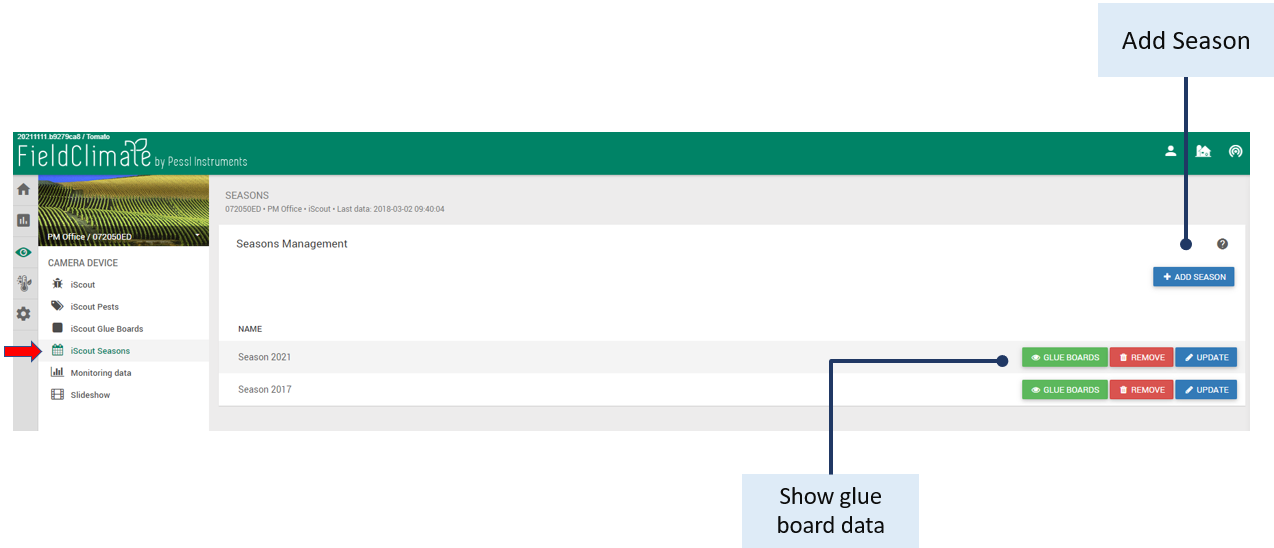
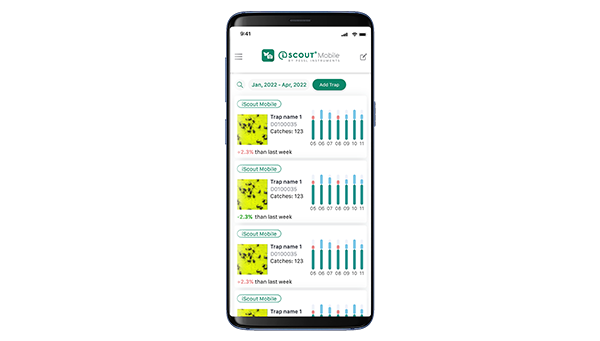
10.5 MONITORING DATA
On this page you will find detections/counts of insects displayed in chart and table form. Click the “Date/Week Select Mode” button to insert the period of time using the calendar to show the data. You can see the data of a specific selected time period (from-to) or of the glueboard or season. When choosing glueboard/season only the targets (defined in glueboards) will be shown and displayed on the monitoring page too. There is the possibility to export charts as image and table as “xls”. Clicking on the Toggle Charts or Toggle Table you can hide chart/table. Be sure to click the “Refresh button” after making any changes.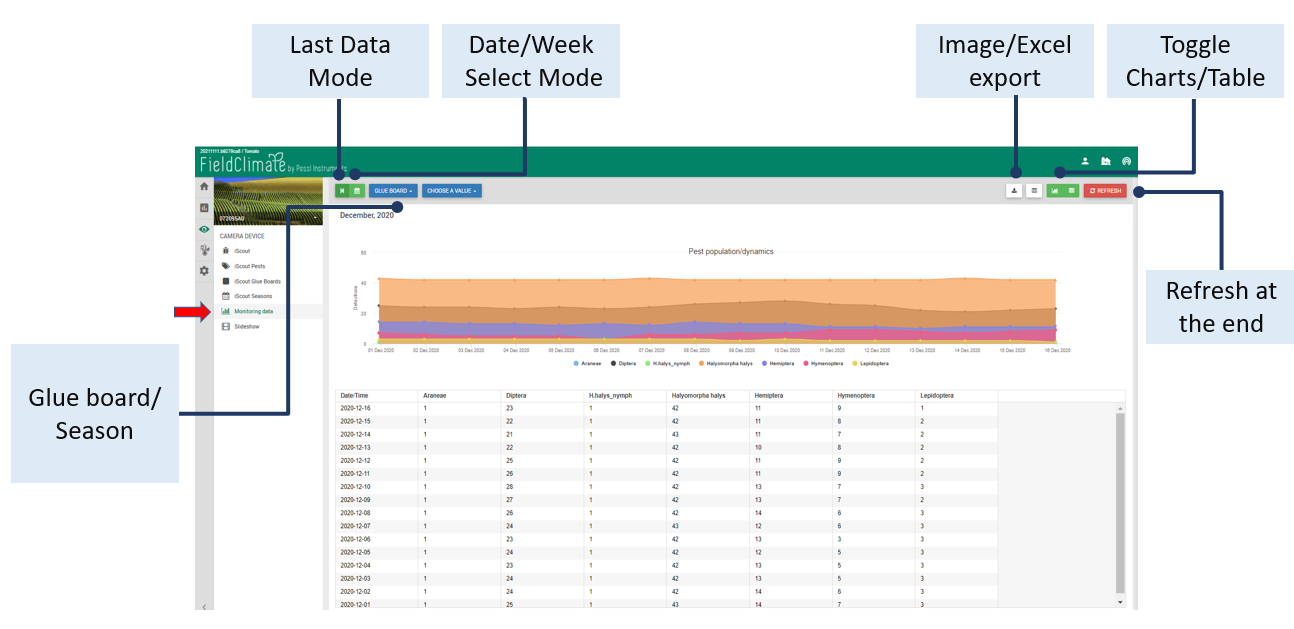
10.6 CAMERA SLIDESHOW
Camera slideshow enables you to view photos as a slideshow. Click the “Date/Week Select Mode” button to insert the period of time using the calendar to show the data. You can also set how fast the presentation should play, rewind or select Fullscreen. Be sure to click the “Refresh button” after making any changes.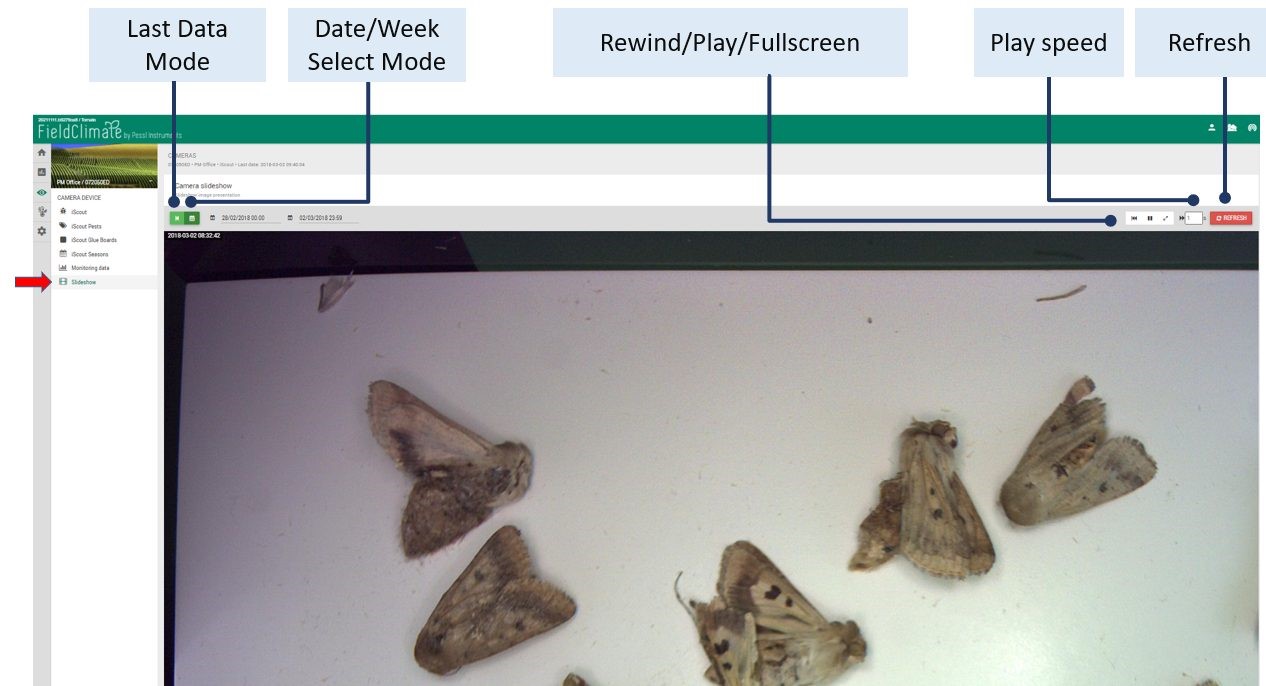
11. STATION SETTINGS PAGE
11.1 CONFIGURATION
11.1.1 TIME ZONE AND LOCATION SETTINGS
Under timezone and location, you need to provide precise information, as weather forecast and other services depend on it. Be aware that precise location and time-zone settings are essential for proper functioning of weather forecast and other services. If your device has a built-in GPS, location and time zone will be acquired automatically. Otherwise, you can also define location manually in different ways: Drag the marker on the map to your location. Enter location (by address) into “location search” box and then click “GO!” button. Enter coordinates of device location to “Longitude, Latitude, Elevation” boxes (you can acquire coordinates with help of your mobile phone, if it has built-in gps). The timezone is automatically set if you drag the marker on the map or if you find the location from the “Location search” input. For entering the time zone manually: Select the correct time zone from a list. When you finish with the configuration, do not forget to save the new settings (click on “save location” button).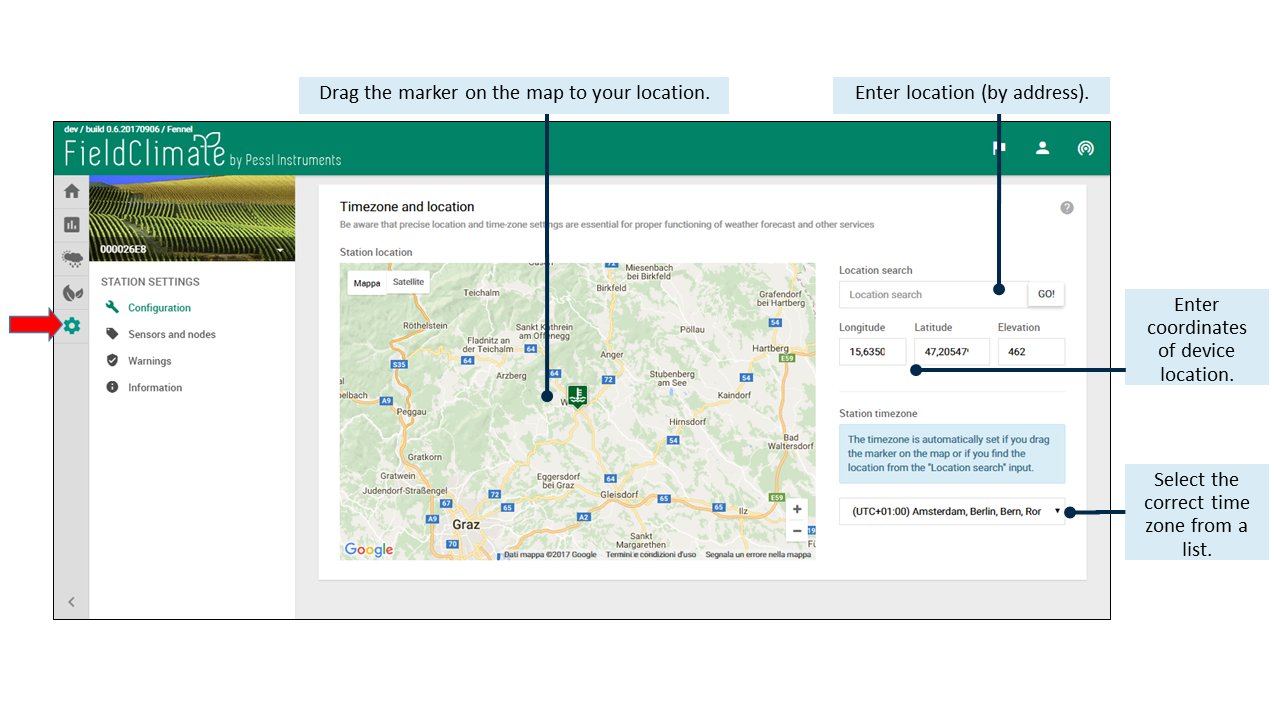
11.1.2 LOGGING AND TRANSFER SETTINGS
Under transfer settings, you can define how your METOS® device is sending data. The setting for logging interval and transmission times will work with the default values, as long it is not changed. The logging interval is set to 60 minutes by default. Shorting the logging interval will increase the power consumption and the data transfer cost. It can be set to 10, 15, 20, 30, 60 and 120 minutes. Logging interval means time interval at which your station will read data from all the sensors and store it to memory. With Scheduler you can select hours of the day (only full hours possible) at which stored data will be transferred to the server. You need to select at least one transmission per day. Using less transfer times will decrease the data transfer cost.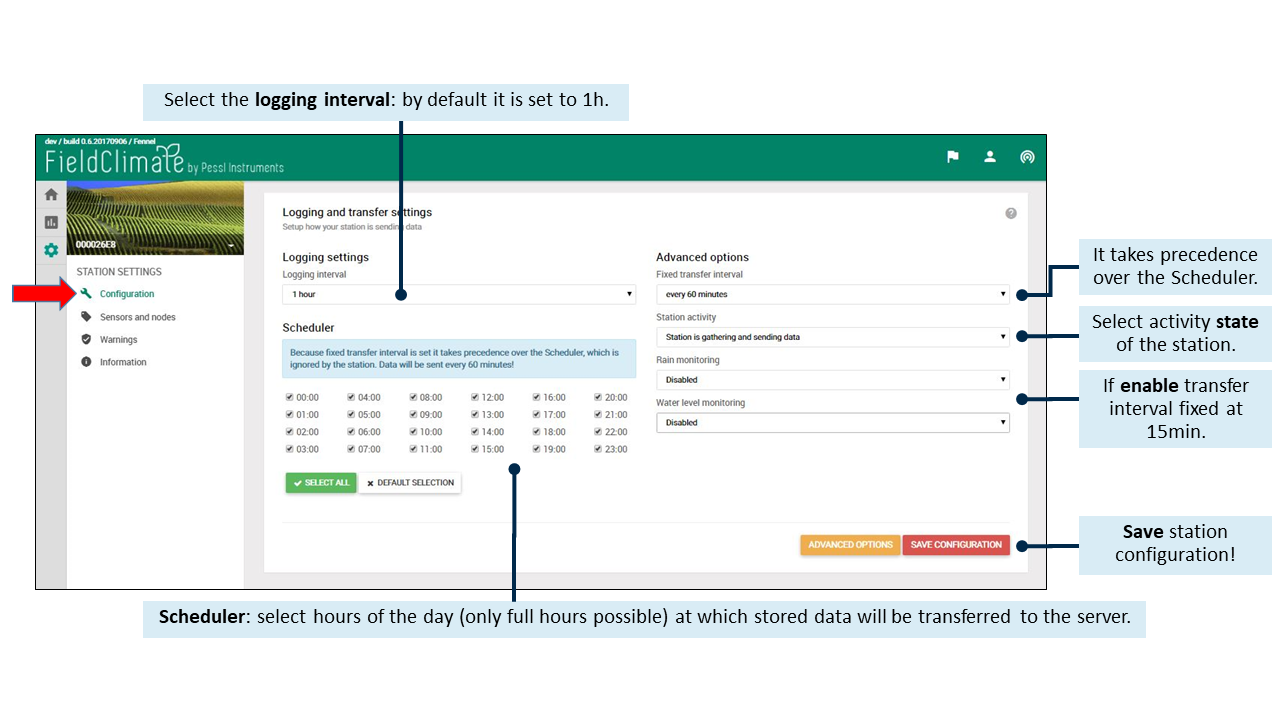 You can set also a user-defined fixed transfer interval. Click “Advanced Options” button and new menus will appear with next options:
- Fixing transfer interval every 60 minutes it takes precedence over the Scheduler, which is ignored by the station: data can be sent every 10, 15, 20, 30 or 60 minutes. You can also disable the fixed transfer interval option giving the precedence to the Scheduler.
- Station activity: here you can select activity state of the station. You can either turn it completely off, with choosing Station is switched off in the drop-down menu or by selecting Station is gathering but not sending data you will put your station in a mode where it is only logging but not transmitting. By default station is set to normal working mode and is gathering and sending data.
- If rain monitoring is enabled, the METOS® device measures, logs and transfers data at a fixed 15 minutes interval while it is raining. By default rain monitoring is off. This option is available only at the stations which have rain gauge sensor.
- If water level monitoring is enabled, the METOS® device sends data to the server every 15 minutes interval during flooding events. The user can define a water level threshold. When the threshold is exceeded, the METOS® device measures, logs and transfers data in the specified interval. This option is available only at the stations which have water level sensor.
11.1.3 CropVIEW® and iSCOUT® CONFIGURATION PAGE
Set up time zone and location: these settings are very important as they are essential for proper functioning of some services. For setting timezone and location CropVIEW® settings follow the same settings for a METOS® device. Set up transfer settings: setup how your CropVIEW® is sending data. Be aware that taking and sending pictures consumes a lot of data and energy. Therefore, we set a limitation to take pictures three times per day. Set up camera: setup camera settings. Be aware that bad settings can result in corrupted images. Change this settings only if you are confident to know what you are doing. For the iSCOUT® you can setup how your station is sending data. To maintain the amount of data under 1GB and inside your monthly plan the maximum number of captured images is limited to three per day. During low temperatures please make sure that your station transmits only once per day due to battery saving. You can also customize your Camera settings, but we suggest to maintain the default settings.11.2 SENSORS AND NODES
In this section, you can define a custom name for your station and all nodes connected to it. Every METOS® device is significantly named by a serial number. For most users it is more convenient to name it after the site is installed. Moreover you can also define a custom name and color for every single sensor that is connected to your station. For every single sensor you can also select a unit in which the value of the sensor will be presented on charts and in tables. After defining custom units, names and colors, you need to save your settings. You can do this by clicking on the “update“ button for every single sensor or at the “save all“ button at the end of the sensor list, to save all at once. The button “Reset Sensors” enables you to reset all sensor units to their default values. (Important note: When you change the unit’s settings (Metric/Imperial) in the User menu, the change only affects default sensor unit settings and not customized unit settings).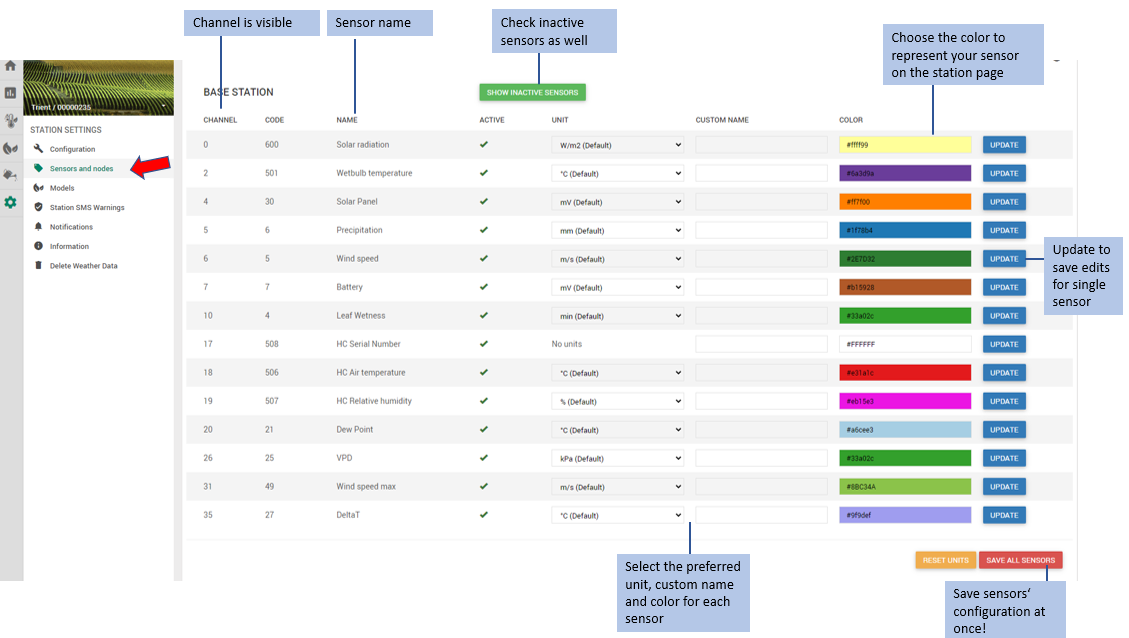
11.3 SMS WARNINGS
11.3.1 PHONE NUMBERS
In this section you can define phone numbers and names associated with it, at which you want that a warning SMS will be sent. Under Add phone number please input phone number together with a country code and a custom name associated with it. After filling the input boxes click on “ADD” button to add the phone number. If you want that a warning SMS is sent to more numbers, you can add additional phone numbers to the list. Under List of phone numbers you will see all phone numbers and associated names that you have added. If you want you can also set the state of a phone number from active (by default) to not active (with clicking on “yes/no“ button). In this way you can choose which phone numbers from the list warning SMS will be sent. By clicking on “remove“ button you can also remove a certain phone number from the list. When you will finish with configuration, do not forget to save new settings that you made (click on “save phone numbers“ button).
11.3.2 SETUP SMS WARNING
The user can define an upper and lower threshold SMS alarm values for each sensor. If a measured value exceeds (or goes below) the establish threshold, the METOS® device will send the SMS with a warning text (name of sensor, actual value, threshold value) to up to 30 different mobile phone numbers. Alarm thresholds are checked every 5 minutes within each measurement. When the METOS® receives the sent acknowledgment from the mobile network the METOS® device will disable SMS sending for 4 hours. But if a measured value drops below the threshold in 3 consequent measurement cycles, the METOS® will again enable the sending of SMS and send the corresponding alarm.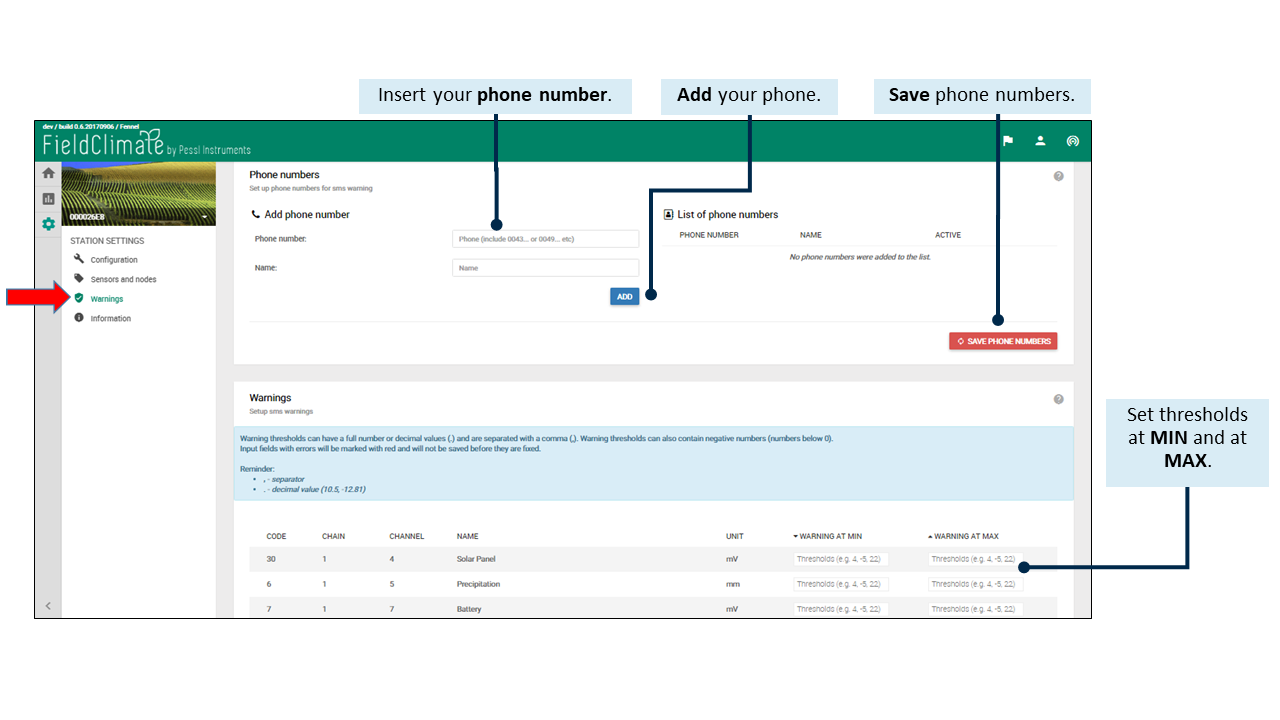
11.4 NOTIFICATIONS
11.4.1 CREATE NEW ALERTS
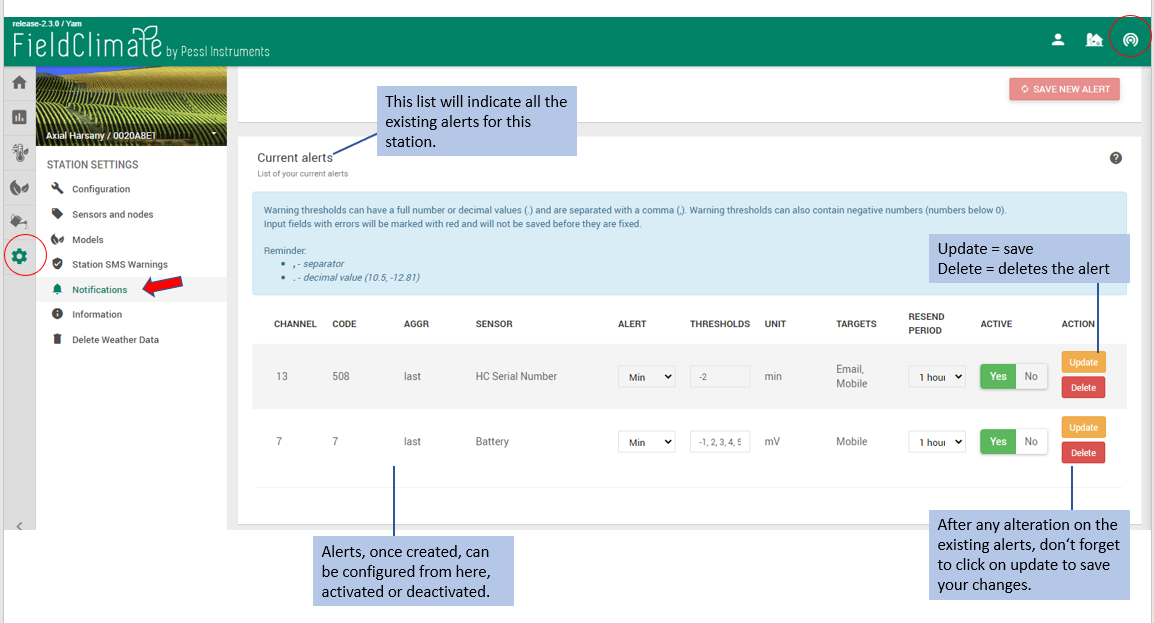
At the notifications page you can create new alerts, while checking and editing the existing alerts. The first part of the screen consists of the creation of new notifications based on station-level. For a particular station, users can indicate if: warning is at maximum or minimum, choose the sensor type, set up one or multiple thresholds, set the resending time, and optionally add an email address. Alerts will, then, follow these settings, sent via email or SMS warning – in case a cellphone number was added in the SMS warnings section.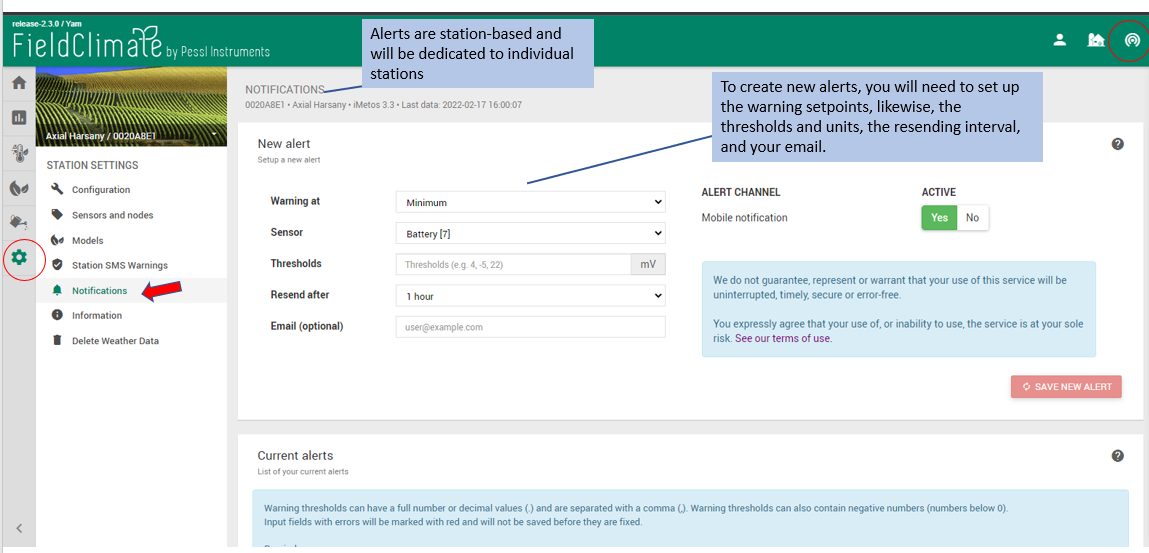 All the notifications created for this station will be visible on the ‘Current alerts’ section. In this section of the page, users can configure, activate or deactivate a current notification. To save new changes don’t forget to click “Update”.
11.5 INFORMATION
This page contents only informations regarding Basic Information, Network Details, Weather Data and GPS Location and there are not any configuration options. In user defined name it is not showing name as you define it in sensors and nodes, instead it is showing “/“ all the time. By clicking on “Station Events“ or “Communication History“ more informations can be shown.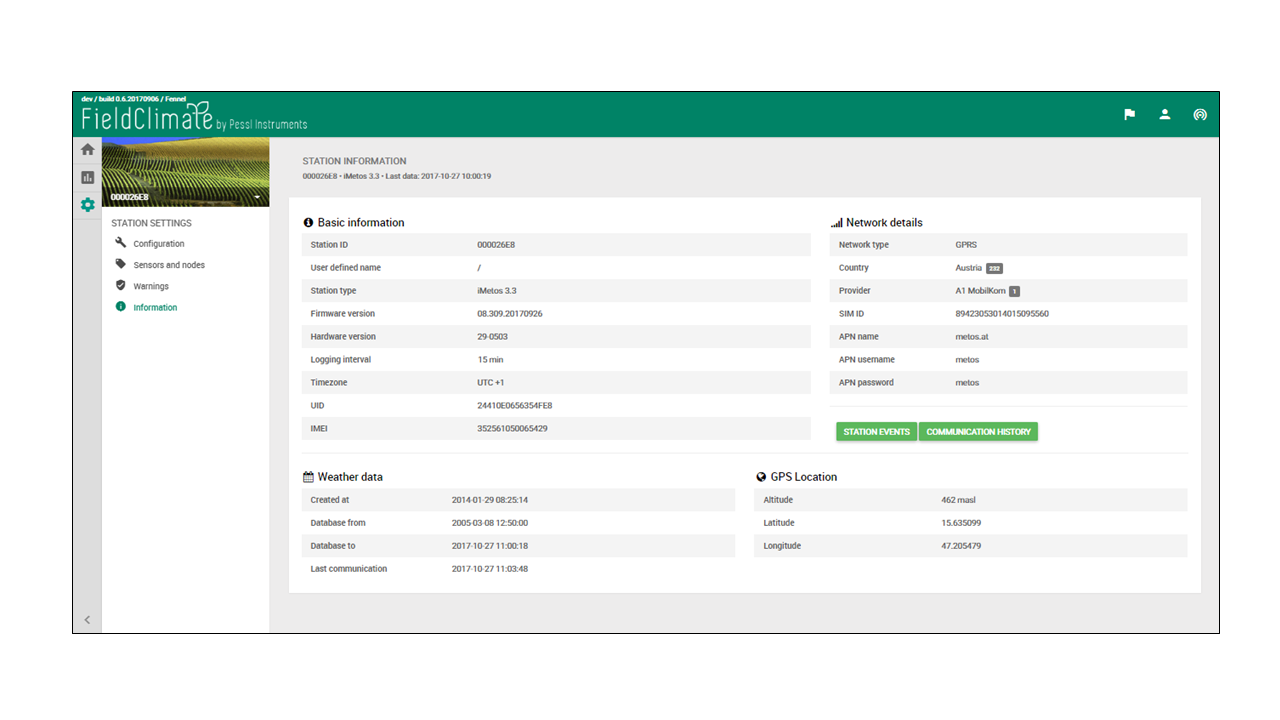
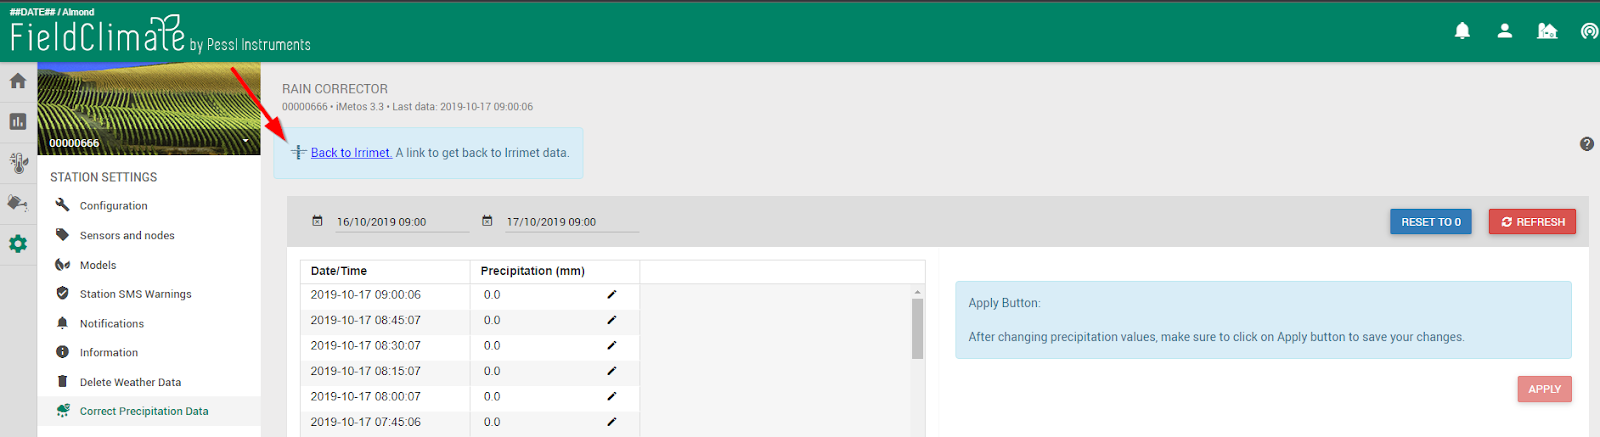
11.6 CORRECT PRECIPITATION DATA
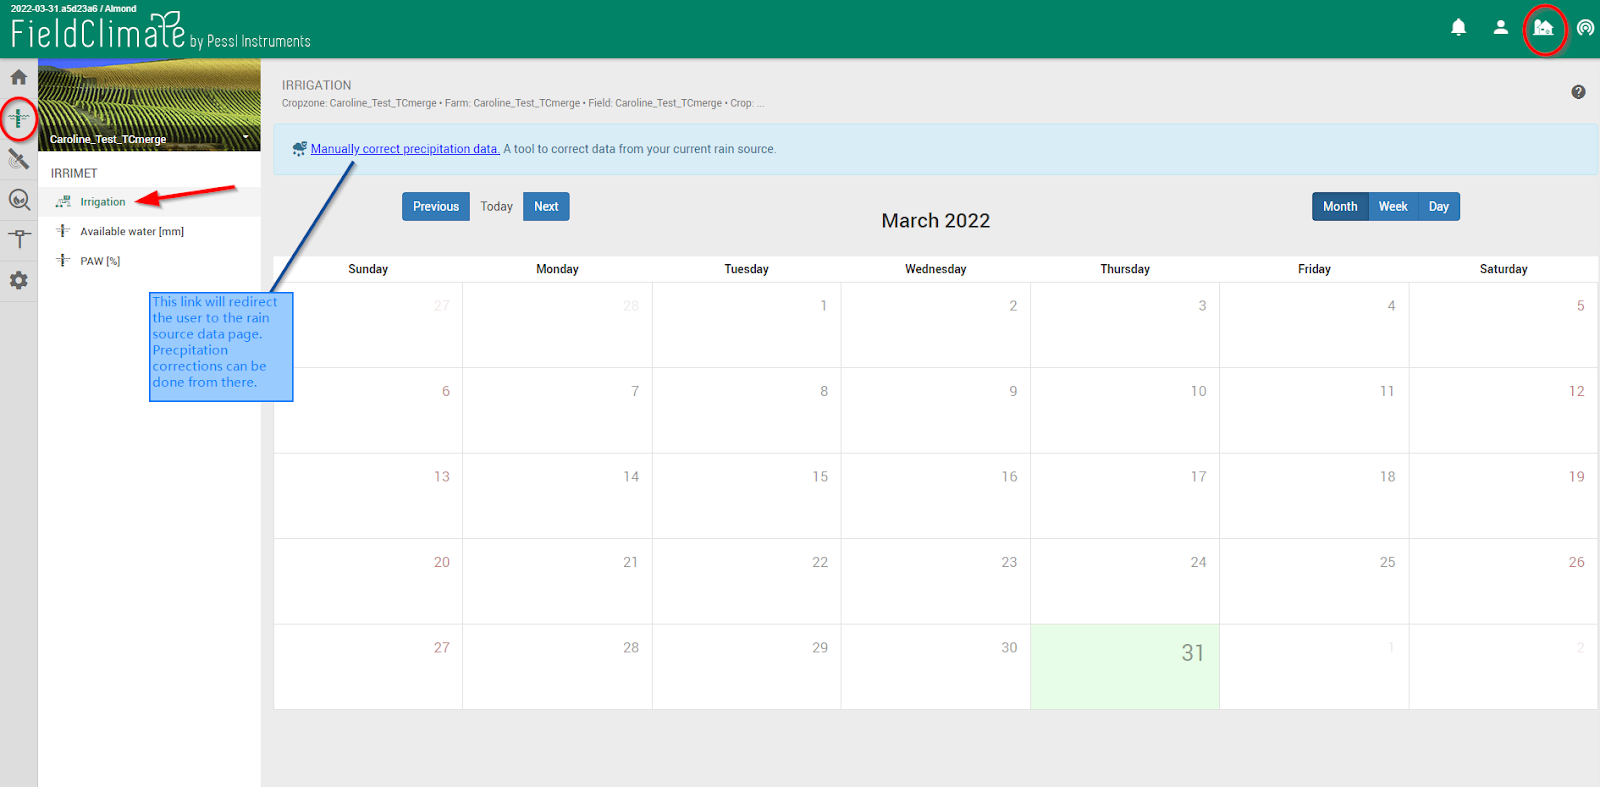
This tool allows users to correct precipitation data from any rain source (physical or virtual stations). The correction needs to be done on the respective rows, for the selected time period, then computed via the ‘APPLY’ button. Once applied, the changes can be instantly seen on all data pages, likewise, on their applications.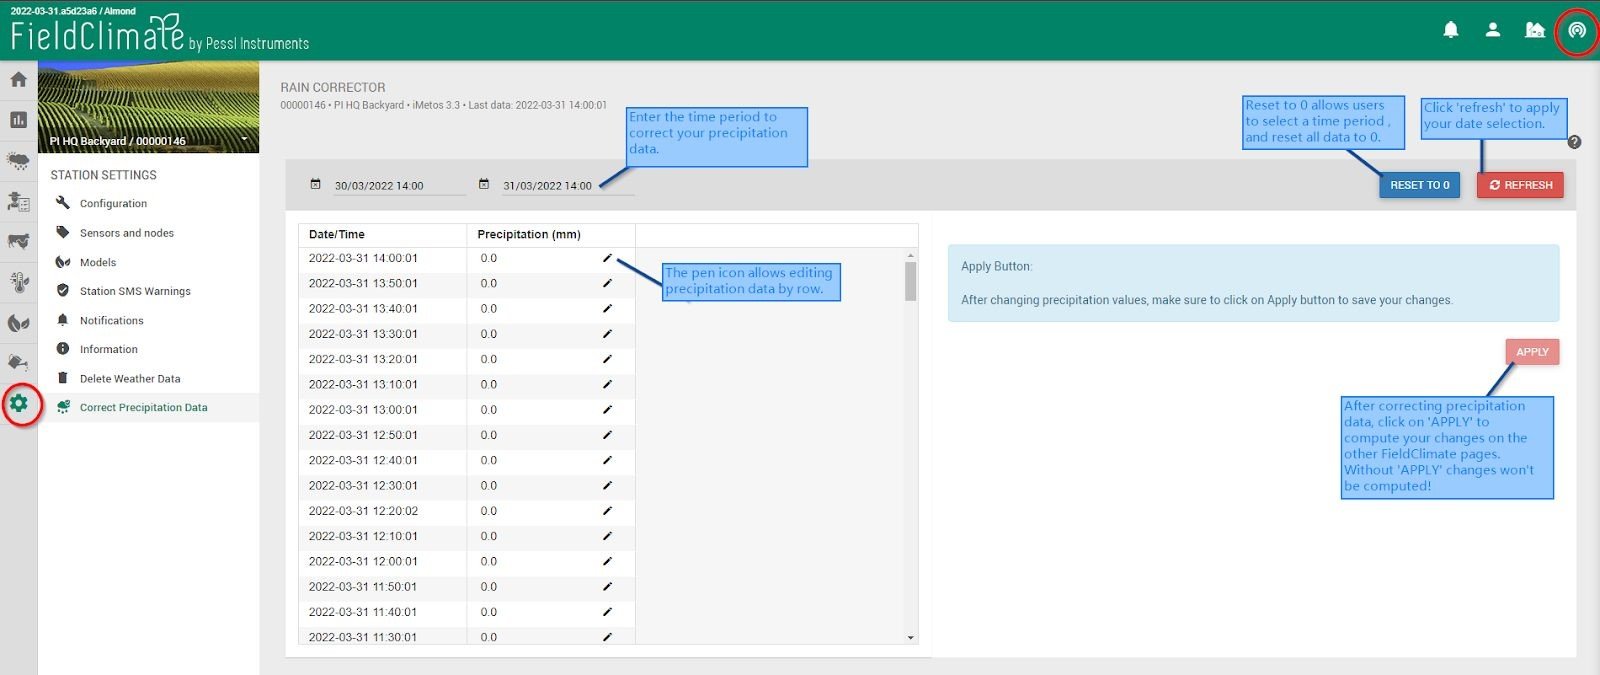 To ‘Correct Precipitation Data’ can be also accessed from the FarmView Irrimet module.
11.7 FROST-MONITORING MODE
This feature enables to automatically set shorter transfer intervals (5 or 10 minutes instead of 1 hour) during frost conditions – only when the temperature value goes below 5°C. This allows a more efficient and smarter management of the battery, increasing its performance, and provides live data of the key frost parameters. Users will not have to worry about changing the settings from FieldClimate, but everything will be automatic!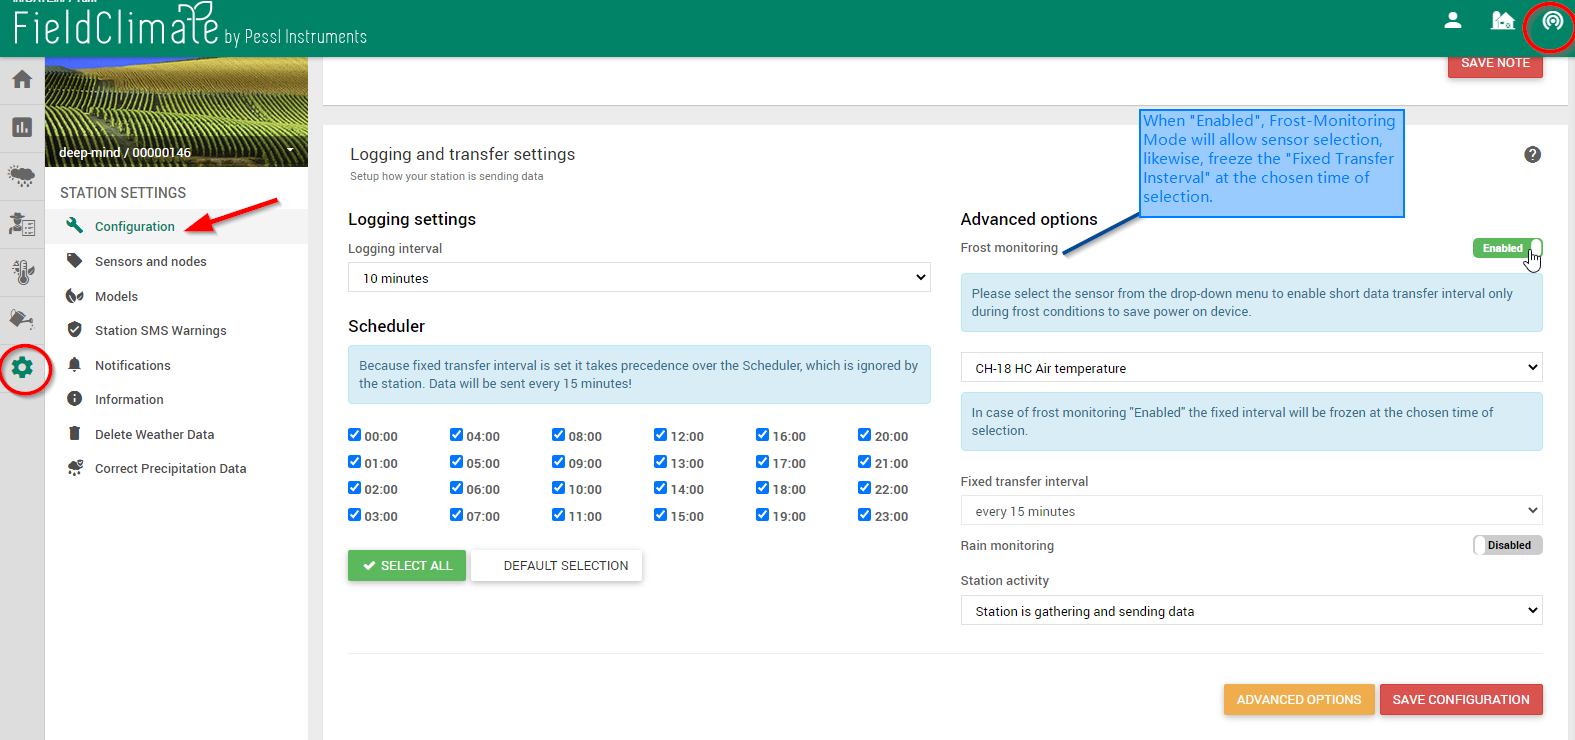
12. SAMPLING DATA VISUALIZATION PAGES
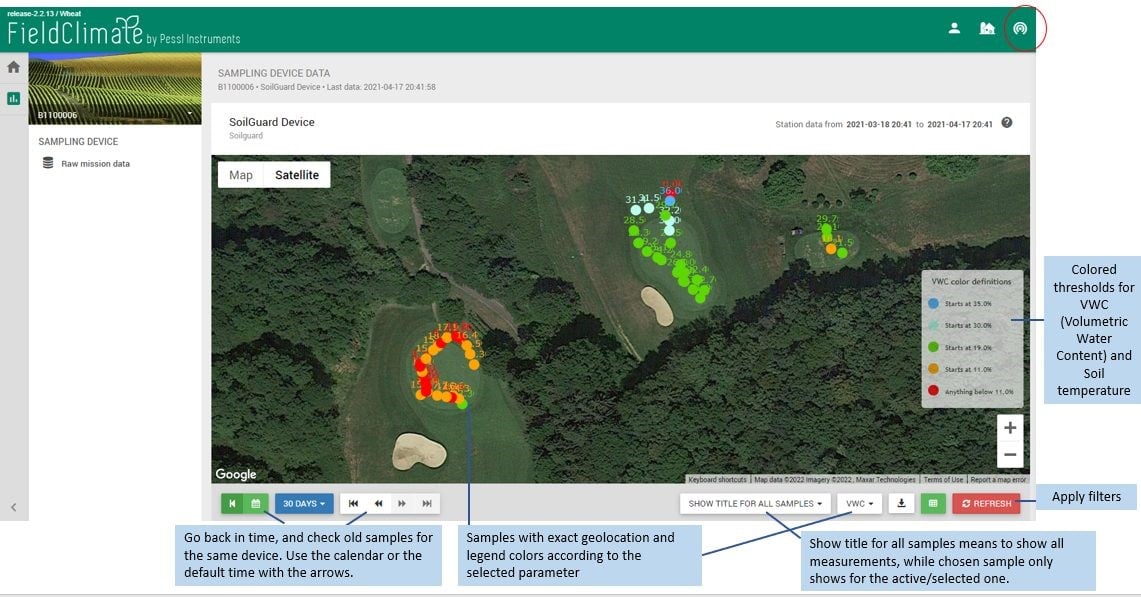
12.1 SoilGuard SAMPLING DATA VISUALIZATION
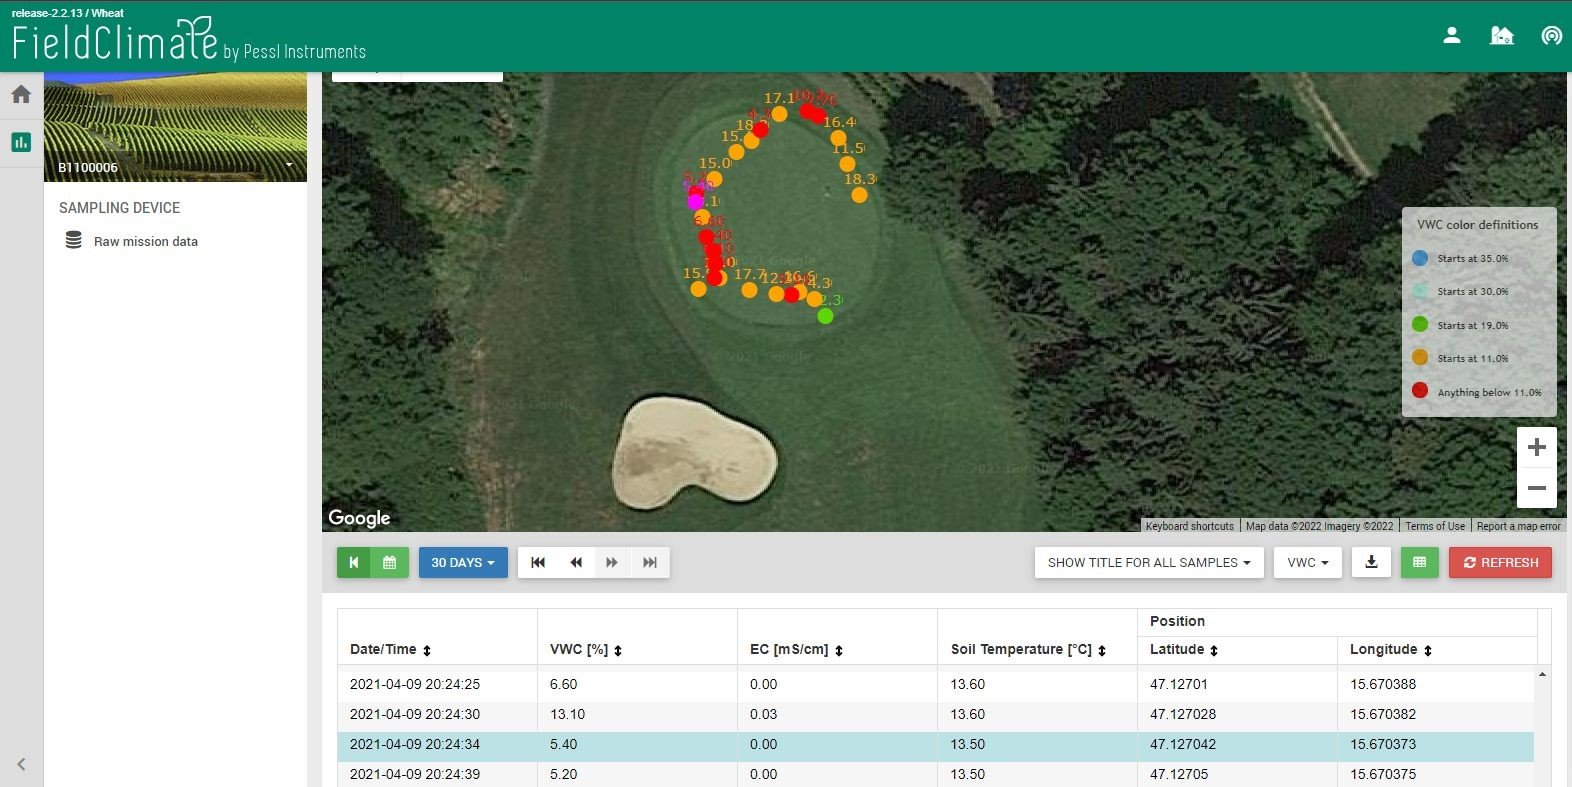
After uploading the SoilGuard data on your PC, via User menu -> data upload -> CSV file upload, you will be able to visualize your SoilGuard sampling data. Files can only be imported in CSV format.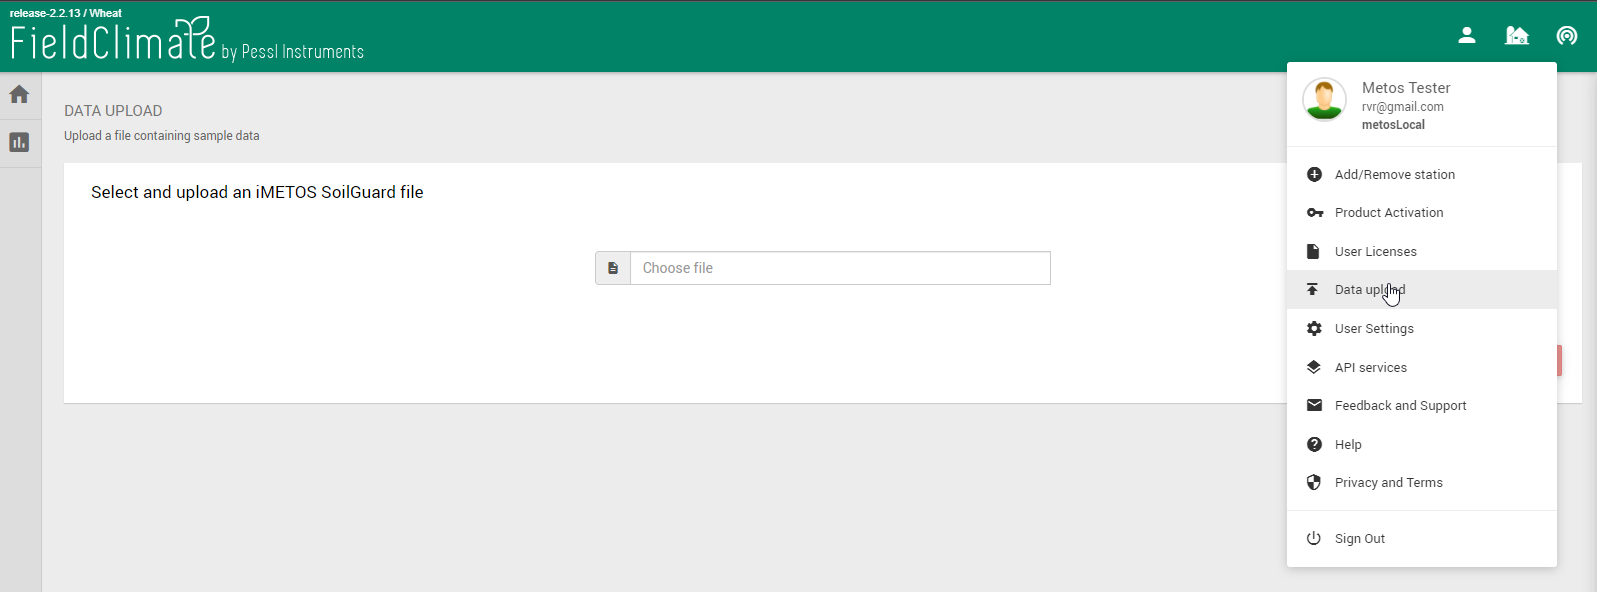 The data consists of the geolocations of all samples on the map, with a raw-data table down the page. In order to see the accurate location, don’t forget to switch on your GPS location on the SoilGuard device before starting with sampling collection, in the field.
The selected sample (violet) can be chosen at any time. The respective measurements will be shown on the raw-data table, highlighted in blue.
The data consists of the geolocations of all samples on the map, with a raw-data table down the page. In order to see the accurate location, don’t forget to switch on your GPS location on the SoilGuard device before starting with sampling collection, in the field.
The selected sample (violet) can be chosen at any time. The respective measurements will be shown on the raw-data table, highlighted in blue.
12.2 Dualex SAMPLING DATA
Data uploading for Dualex devices can be done through User menu -> data upload -> CSV file upload. The latest data will be visible on the map with the possibility to go back in time via the calendar and/or navigation arrows.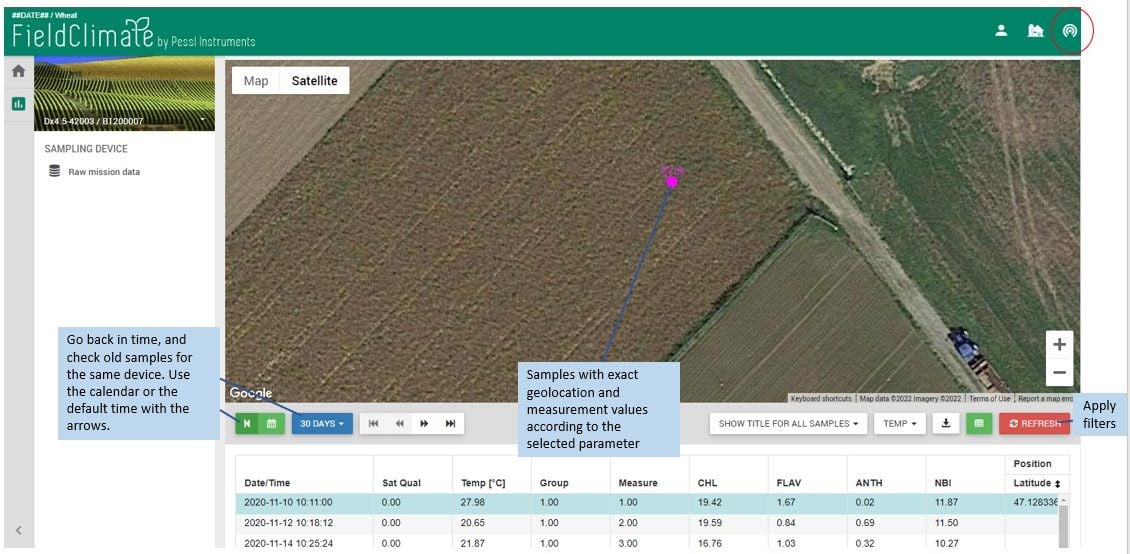
12.3 MobiLab SAMPLES
12.3.1 How to upload data from MobiLab?
MobiLab data can be uploaded via the mobile app: MobiLab Sampler available for Android and iOS version. Step-by-step is below: 1- Download the MobiLab app for iOS or Android; 2- Register your sample locations on the app, respectively creating individual IDs for each one of them; 3- Download the Desktop Software from MobiLab on your computer; 4- Within the Desktop Software, execute the measurements for soil or Plant SAP; 5- Results will appear on the Desktop Software. For more information, check the manual. 6- To visualize data in the FieldClimate platform, users need to sync data from Desktop Software to the FieldClimate server.12.3.2 How to visualize MobiLab data in FieldClimate?
After the data sync is done, MobiLab data can be accessed via the station list or via cropzone list in the case of FarmView users. For the first option, data display will look this: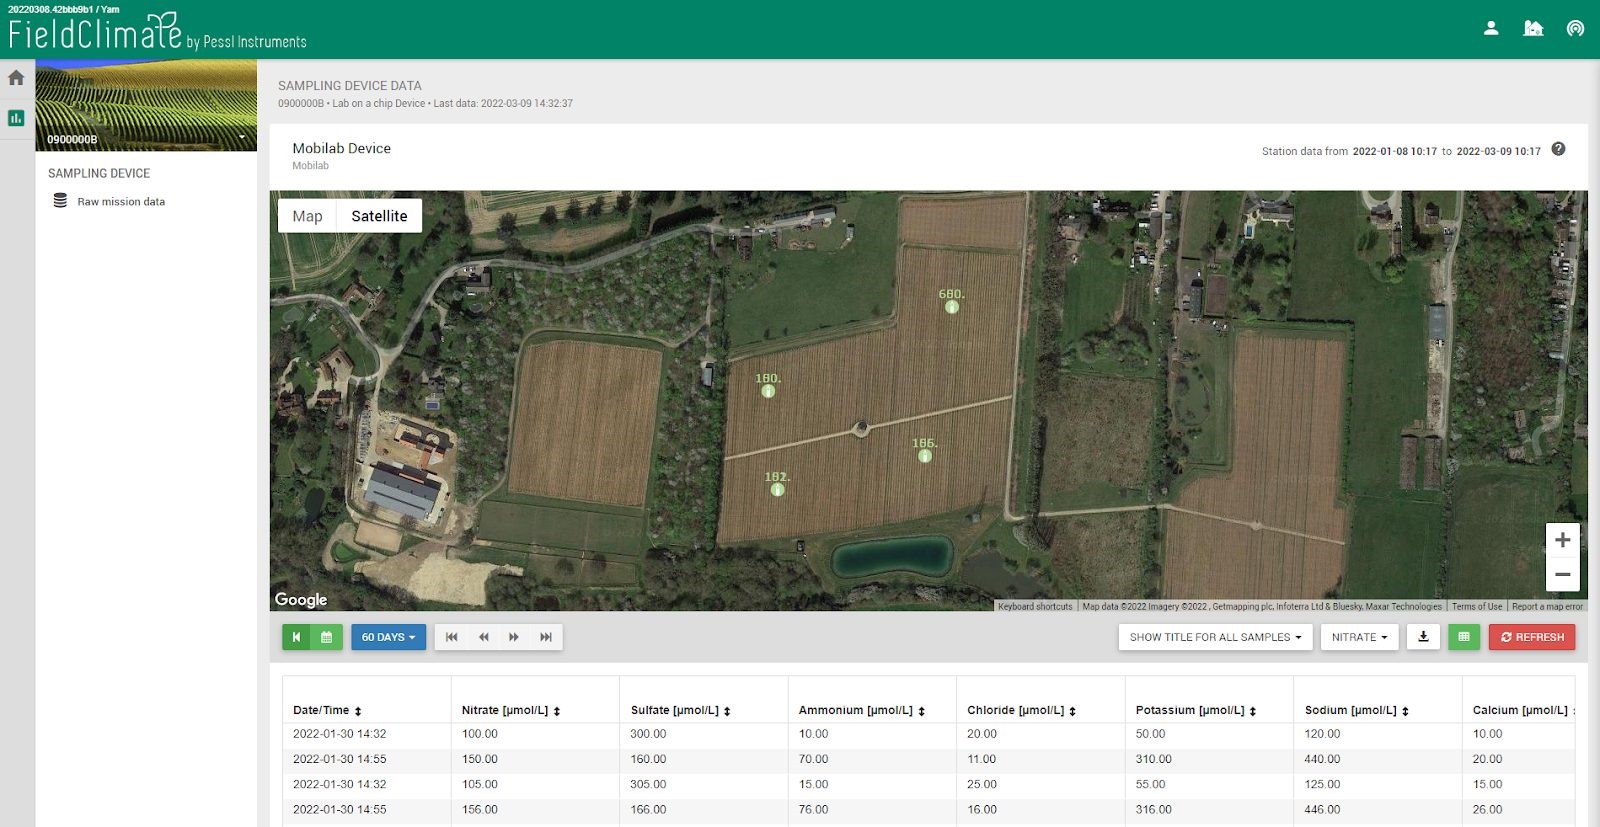
13. CALCULATED SENSORS
13.1 VIRTUAL SENSORS
Virtual Sensors provide readings of physical properties that are not measured directly but derived from the readings of other sensors.13.1.1 EVAPOTRANSPIRATION
ET0 daily evapotranspiration is calculated with the FAO-56 Penman-Monteith equation and needs measurements (sensors) of:- Air temperature
- Air humidity
- Solar radiation
- Wind speed
13.1.2 VPD
Vapour pressure deficit requires an hygroclip sensor (air temperature and relative humidity) and is in a close relationship to evapotranspiration. VPD is an indication that takes into account the effect of temperatures on the water-holding capacity of the air, which is what drives transpiration of the leaf surface (transpiration occures when water pressure in leaves is higher then air vapour pressure). For more detailed information visit Virtual sensors page.13.1.3 DEW POINT
It requires an air temperature and relative humidity sensor and it is the temperature of when water vapour held in the air will condense to form a liquid or it’s the temperature to which air cools when dew is formed.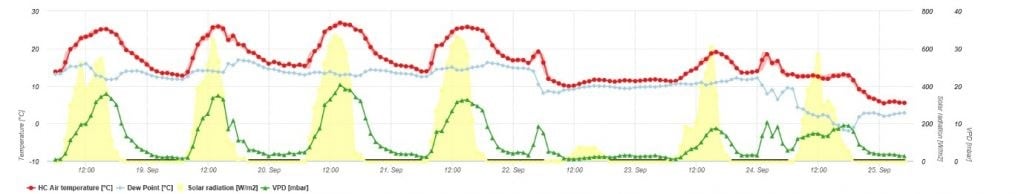 For more detailed information visit Virtual sensors page.
13.1.4 DELTA T
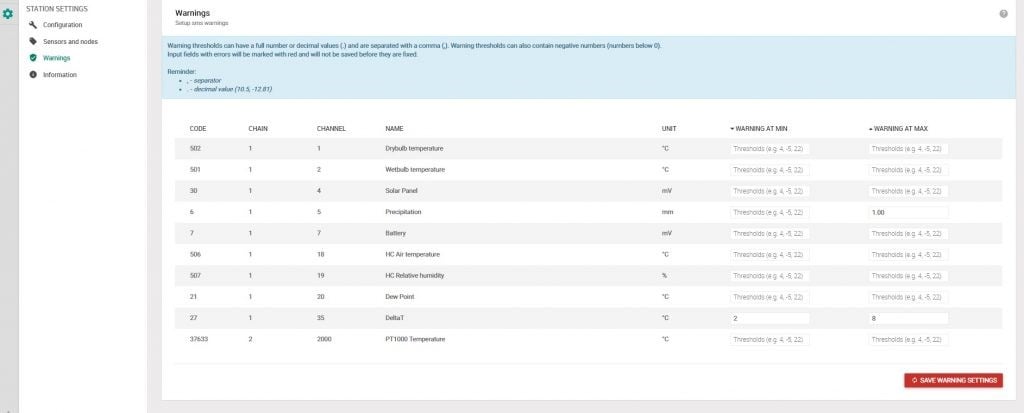
Delta T calculation requires an hygroclip sensor (Air Temperature and Relative Humidity) installed on the METOS® station: data can be viewed on FieldClimate in charts and tables with a detailed resolution. It is a measure that takes into account the combined effects of temperature and humidity and it indicates whether climatic conditions are suitable for spraying in order to maximize pesticide performance (A. MacGregor, 2010). The optimal Delta T range is between 2°C and 8°C. Keep monitoring Delta T reading and set up an efficient spray on schedule. Weather conditions can change rapidly during the day, so having the ability to monitor delta T can help to improve pesticide performance. DELTA IN FIELDCLIMATE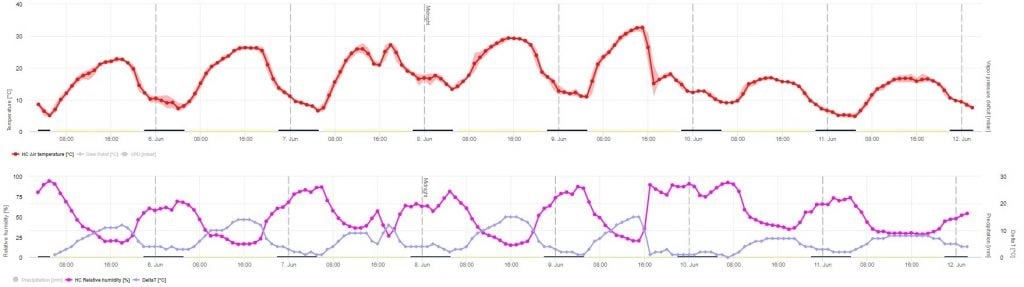 SET DELTA T SMS ALERTS
On-site weather condition readings are required before each spray, in particular, a live reading of Delta T is always recommended. Set a minimum or maximum threshold for SMS warnings. Delta T live reading is updated every 5 minutes.
SET DELTA T SMS ALERTS
On-site weather condition readings are required before each spray, in particular, a live reading of Delta T is always recommended. Set a minimum or maximum threshold for SMS warnings. Delta T live reading is updated every 5 minutes.
 For more detailed information visit the Virtual sensors page.