
Carrot (Daucus carota) — Alternaria dauci causes Leaf Blight.
Host: Carrot, Parsley
The disease is caused by the pathogen Alternaria dauci. The pathogen overwinters in crop refuse or on alternate hosts. The disease also may be seed borne. Older leaves are more susceptible to Alternaria spp. than younger leaves. Leaf spots are common in carrots grown for seed production.
Symptoms
Alternaria leaf blight usually appears first in early fall on older leaves (sometimes called late blight). When large amounts of infested refuse are present, spring infection can occur. Seedlings can develop a damping-off symptom from early infections. Lesions generally appear along leaf margins and are dark brown to black with a yellow border. Spots may coalescence, girdling the petiole and killing the leaf. The spots of this disease are easily confused with Cercospora leaf blight, but Alternaria generally is more irregularly shaped and darker in color.
Model TOMCAST
Background: TOMCAST (TOMato disease foreCASTing) is a computer model based on field data that attempts to predict fungal disease development, namely Early Blight, Septoria Leaf Spot and Anthracnose on tomatoes. Field-placed data loggers are recording hourly leaf wetness and temperature data. These data were analysed over a 24-hour period and may result in the formation of a Disease Severity Value (DSV); essentially an increment of disease development. As DSV accumulate, disease pressure continues to build on the crop. When the number of accumulated DSV exceed the spray interval, a fungicide application is recommended to relieve the disease pressure.
TOMCAST is derived from the original F.A.S.T. (Forecasting Alternaria solani on Tomatoes) model developed by Drs. Madden, Pennypacker, and MacNab? at Pennsylvania State University (PSU). The PSU F.A.S.T. model was further modified by Dr. Pitblado at the Ridgetown College in Ontario into what we now recognize as the TOMCAST model used by Ohio State University Extension.
What is DSV?
A Disease Severity Value (DSV) is the unit of measure given to a specific increment of disease (early blight) development. In other words, a DSV is a numerical representation of how fast or slow disease (early blight) is accumulating in a tomato field. The DSV is determined by two factors; leaf wetness and temperature during the “leaf wet” hours. As the number of leaf wet hours and temperature increases, DSV accumulate at a faster rate. See the Disease Severity Value Chart below.
Conversely, when there are fewer leaf wet hours and the temperature is lower, DSV accumulates slowly if at all. When the total number of accumulated DSV exceeds a preset limit, called the spray interval or threshold, a fungicide spray is recommended to protect the foliage and fruit from disease development.
The spray interval (which determines when you should spray) can range between 15-20 DSV. The exact DSV a grower should use is usually supplied by the processor and depends on the fruit quality.
Following a 15 DSV spray interval is a conservative use of the TOMCAST system, meaning you will spray more often than a grower who uses a 19 DSV spray interval with the TOMCAST system. The trade-off is in the number of sprays applied during the season and the potential for the difference in fruit quality.
Studies have been initiated at Michigan Staate University to test the disease forecasting system, TomCast, for use in managing foliar blights on carrots. TomCast has been used commercially in tomato production and has recently been adapted for use in the disease management of asparagus. Processing carrots ‘Early Gold’ were planted with a precision vacuum seeder at the MSU Muck Soils Research Farm in three rows 18 inches apart on a raised bed that was 50 feet long. Carrot beds were spaced on 64-inch centers and in-row seed spacing was 1 inch.
Each of the four replications of the experiment was located in separate blocks of carrots that consisted of 36 beds. Seventeen treatment beds 20 feet long were randomly placed in a checkerboard pattern in each replication. Treatments were applied with a CO2 backpack sprayer that was calibrated to deliver 50 gallons per acre of spray solution using 8002 flat fan nozzles.
Treatments consisted of untreated and different schedule applications of Bravo Ultrex 82.5WDG (22.4 oz/A) alternated with Quadris 2.08SC (6.2 fl oz/A). The chemical program was applied on a 10-day calendar program as well as when predicted by the TomCast disease forecaster. Three different prediction thresholds of 15, 20, and 25 DSVs were used to time fungicide applications. When the cumulative daily DSV values reached the determined threshold a spray would be applied.
Each treatment regime was initiated at four different levels of disease pressure (0%, trace, 5%, and 10% foliar blight). The first treatments were applied on 2 July and the last application of any treatment was made on 21 September. Ten feet of each centre row of the spray blocks were marked before the first application and were used for weekly disease ratings (see graphs, below). Yields were taken from the same ten feet section of row by hand harvesting the carrots and topping and weighing.
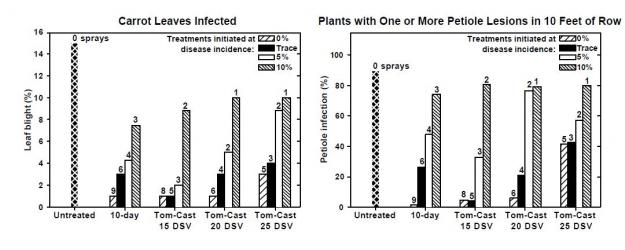
This indicates that the first treatment in carrots should be done as soon as we can find the first disease incidence in the field. From now on it worked fine by the use of the TomCast model with a threshold of 20 DSV accumulated since the last spray.
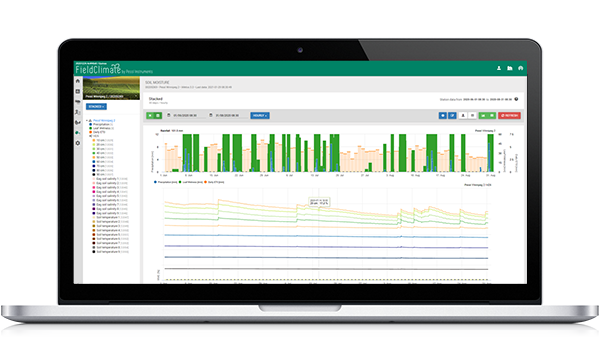
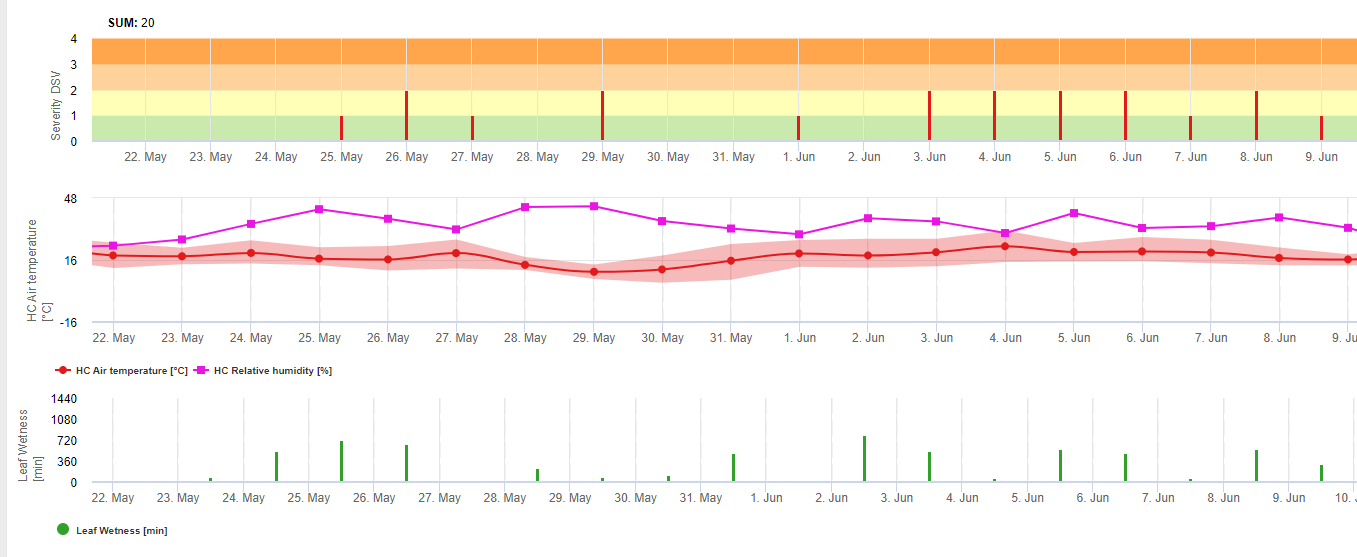
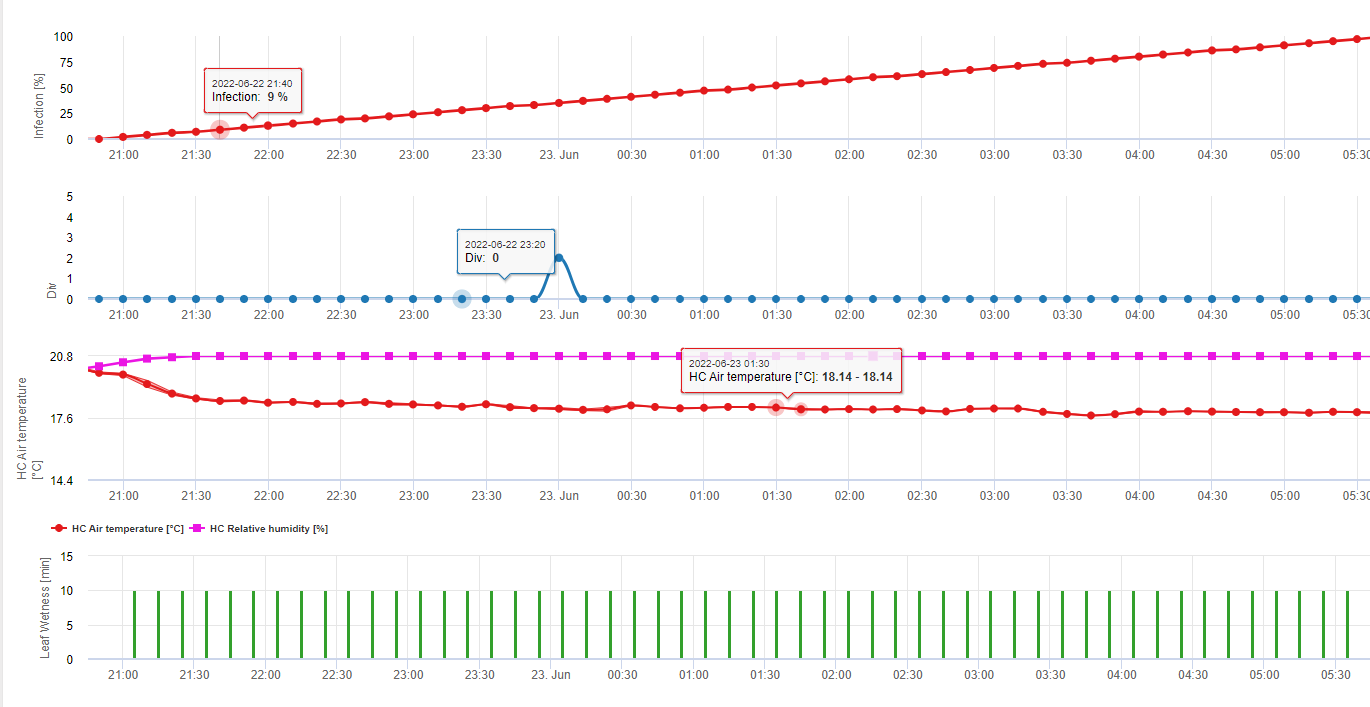
FieldClimate determines the severity of an Alternaria Infection in two different models:
1. TomCast Alternaria Model: independence of the climatic conditions of hours of leaf wetness and air temperature, values of the severity of an Infection (from 0 – 4, see the table here) are determined.
2. Infection of Alternaria daucii & alternata: In this model, a rain event does not have to take place to calculate Alternaria Infections. The involved climatic conditions are the duration of leaf wetness, air temperature and relative humidity. Under favourable conditions, the Infection will be 100%, which means that Alternaria spores had already favourable conditions to infest new plant tissue (see the table here).
Source: Jim Jasinski, TOMCAST Coordinator FOR OHIO, INDIANA, & MICHIGAN